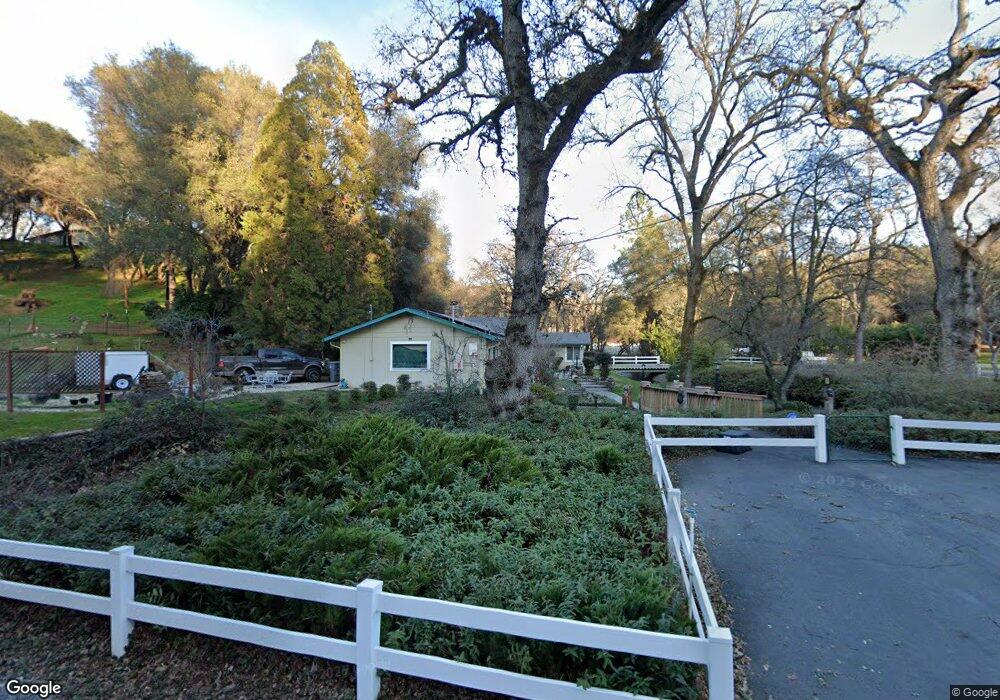
5000 Winding Way Auburn, CA 95602
Estimated Value: $653,000 - $742,000
3
Beds
2
Baths
2,400
Sq Ft
$294/Sq Ft
Est. Value
About This Home
This home is located at 5000 Winding Way, Auburn, CA 95602 and is currently estimated at $705,537, approximately $293 per square foot. 5000 Winding Way is a home located in Placer County with nearby schools including Placer High School and Cornerstone Christian Schools.
Ownership History
Date
Name
Owned For
Owner Type
Purchase Details
Closed on
Aug 28, 2002
Sold by
Morin Ronald D and Morin Mary G
Bought by
Morin Ronald D and Morin Mary G
Current Estimated Value
Home Financials for this Owner
Home Financials are based on the most recent Mortgage that was taken out on this home.
Original Mortgage
$130,000
Outstanding Balance
$52,415
Interest Rate
6.29%
Mortgage Type
Purchase Money Mortgage
Estimated Equity
$653,122
Purchase Details
Closed on
Feb 19, 1999
Sold by
Morin Ronald D and Morin Mary G
Bought by
Morin Ronald D and Morin Mary G
Purchase Details
Closed on
Nov 2, 1998
Sold by
Meyers Doris D
Bought by
Morin Ronald D and Morin Mary G
Home Financials for this Owner
Home Financials are based on the most recent Mortgage that was taken out on this home.
Original Mortgage
$100,000
Interest Rate
6.61%
Mortgage Type
Purchase Money Mortgage
Create a Home Valuation Report for This Property
The Home Valuation Report is an in-depth analysis detailing your home's value as well as a comparison with similar homes in the area
Purchase History
| Date | Buyer | Sale Price | Title Company |
|---|---|---|---|
| Morin Ronald D | -- | Placer Title | |
| Morin Ronald D | -- | Placer Title Company | |
| Morin Ronald D | -- | -- | |
| Morin Ronald D | $275,000 | Placer Title Company |
Source: Public Records
Mortgage History
| Date | Status | Borrower | Loan Amount |
|---|---|---|---|
| Open | Morin Ronald D | $130,000 | |
| Previous Owner | Morin Ronald D | $100,000 |
Source: Public Records
Tax History
| Year | Tax Paid | Tax Assessment Tax Assessment Total Assessment is a certain percentage of the fair market value that is determined by local assessors to be the total taxable value of land and additions on the property. | Land | Improvement |
|---|---|---|---|---|
| 2025 | $4,705 | $456,964 | $125,404 | $331,560 |
| 2023 | $4,705 | $439,222 | $120,536 | $318,686 |
| 2022 | $4,630 | $430,611 | $118,173 | $312,438 |
| 2021 | $4,465 | $422,168 | $115,856 | $306,312 |
| 2020 | $4,433 | $417,841 | $114,669 | $303,172 |
| 2019 | $4,351 | $409,649 | $112,421 | $297,228 |
| 2018 | $4,116 | $401,617 | $110,217 | $291,400 |
| 2017 | $4,043 | $393,743 | $108,056 | $285,687 |
| 2016 | $3,957 | $386,024 | $105,938 | $280,086 |
| 2015 | $3,862 | $380,226 | $104,347 | $275,879 |
| 2014 | $3,803 | $372,778 | $102,303 | $270,475 |
Source: Public Records
Map
Nearby Homes
- 13080 Lone Star Rd
- 13399 Bell Brook Dr
- 24316 Timber Ridge Dr
- 6055 Stanley Dr
- 14580 Mcelroy Rd
- 5575 Stanley Dr
- 6323 Virginia Dr
- 5475 Stanley Dr
- 6715 Grass Valley Hwy
- 1 Joeger Rd
- 0 Fawnridge Rd
- 3165 Ray Cir
- 4721 Grass Valley Hwy
- 11700 Quail Rd
- 3110 Iron Mine Rd
- 26583 Table Meadow Rd
- 14470 Riva Ridge Cir
- 2653 Christian Valley Rd
- 0 Dry Creek Rd Unit 225060351
- 11919 Brooke Crest Dr
- 13125 Bell Brook Dr
- 0 Bear River Ln
- 13100 Bell Brook Dr
- 5055 Winding Way
- 5205 Winding Way
- 4986 Winding Way
- 5400 Winding Way
- 13200 Bell Brook Dr
- 5415 Winding Way
- 5460 Grass Valley Hwy
- 4970 Winding Way
- 5500 Winding Way
- 5555 Winding Way
- 4965 Winding Way
- 4804 Winding Way
- 5600 Winding Way
- 13355 Bell Brook Dr
- 5615 Winding Way
- 13369 Bell Brook Dr
- 5550 Winding Way
Your Personal Tour Guide
Ask me questions while you tour the home.