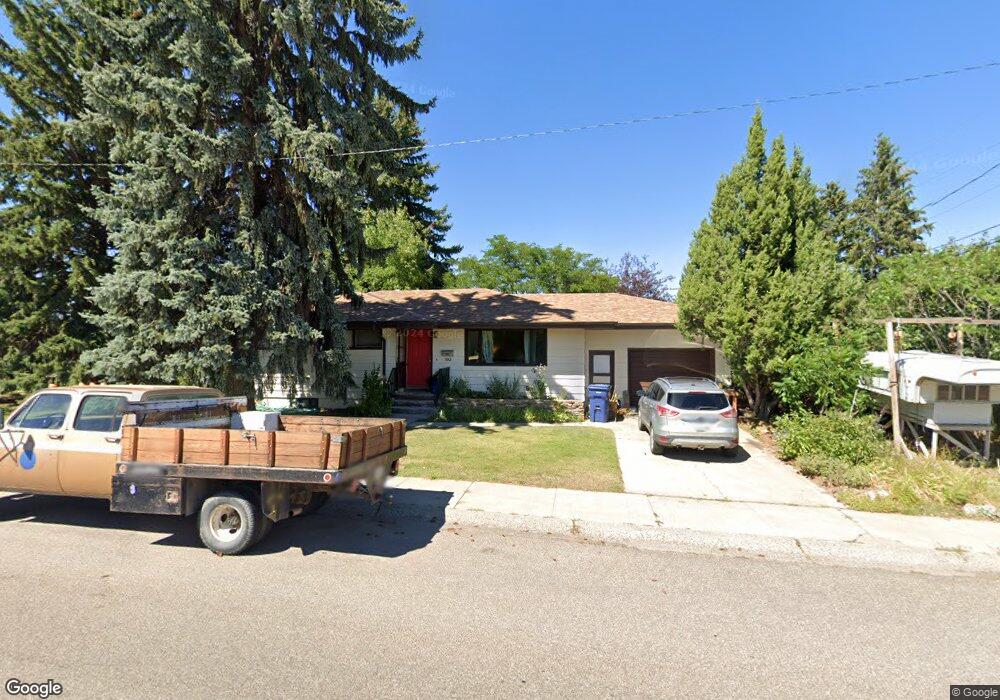
5001 7th Ave S Great Falls, MT 59405
Estimated Value: $290,000 - $343,000
3
Beds
2
Baths
2,454
Sq Ft
$128/Sq Ft
Est. Value
About This Home
This home is located at 5001 7th Ave S, Great Falls, MT 59405 and is currently estimated at $315,291, approximately $128 per square foot. 5001 7th Ave S is a home located in Cascade County with nearby schools including Chief Joseph School, East Middle School, and Great Falls High School.
Ownership History
Date
Name
Owned For
Owner Type
Purchase Details
Closed on
Sep 4, 2013
Sold by
Ondick Andrew R and Ondick Cathy J
Bought by
Ondick Todd A and Ondick Sadie R
Current Estimated Value
Home Financials for this Owner
Home Financials are based on the most recent Mortgage that was taken out on this home.
Original Mortgage
$105,600
Outstanding Balance
$26,834
Interest Rate
4.27%
Mortgage Type
New Conventional
Estimated Equity
$288,457
Purchase Details
Closed on
Jun 8, 2011
Sold by
Ondick Andrew R and Ondick Cathy J
Bought by
Ondick Andrew R and Ondick Cathy J
Purchase Details
Closed on
Aug 15, 2006
Sold by
Gilmor Mary E
Bought by
Ondick Andrew R and Ondick Cathy J
Home Financials for this Owner
Home Financials are based on the most recent Mortgage that was taken out on this home.
Original Mortgage
$108,320
Interest Rate
6.76%
Mortgage Type
New Conventional
Create a Home Valuation Report for This Property
The Home Valuation Report is an in-depth analysis detailing your home's value as well as a comparison with similar homes in the area
Purchase History
| Date | Buyer | Sale Price | Title Company |
|---|---|---|---|
| Ondick Todd A | -- | Chicago Title Company | |
| Ondick Andrew R | -- | None Available | |
| Ondick Andrew R | -- | Chicago Title Insurance Comp |
Source: Public Records
Mortgage History
| Date | Status | Borrower | Loan Amount |
|---|---|---|---|
| Open | Ondick Todd A | $105,600 | |
| Closed | Ondick Andrew R | $108,320 |
Source: Public Records
Tax History
| Year | Tax Paid | Tax Assessment Tax Assessment Total Assessment is a certain percentage of the fair market value that is determined by local assessors to be the total taxable value of land and additions on the property. | Land | Improvement |
|---|---|---|---|---|
| 2025 | $2,025 | $293,100 | $0 | $0 |
| 2024 | $2,439 | $231,900 | $0 | $0 |
| 2023 | $2,391 | $231,900 | $0 | $0 |
| 2022 | $1,993 | $172,100 | $0 | $0 |
| 2021 | $1,820 | $172,100 | $0 | $0 |
| 2020 | $1,992 | $167,200 | $0 | $0 |
| 2019 | $1,900 | $167,200 | $0 | $0 |
| 2018 | $1,820 | $157,300 | $0 | $0 |
| 2017 | $1,722 | $157,300 | $0 | $0 |
| 2016 | $1,601 | $154,800 | $0 | $0 |
| 2015 | $1,488 | $154,800 | $0 | $0 |
| 2014 | $1,592 | $79,765 | $0 | $0 |
Source: Public Records
Map
Nearby Homes
- 4808 Carol Dr
- 714 48th St S
- 5308 5th Ave S
- 4708 3rd Ave S
- 520 46th St S
- 701 55th St S
- 4604 3rd Ave S Unit 16
- 620 57th St S
- 729 46th St S
- 4404 5th Ave S
- NHN 57th St S
- 67 Silver Mine Ln
- TBD 10th Ave S
- 605 Alice Dr
- 4217 Clark Ave
- 4209 Clark Ave
- Parcel 2630700
- 4501 2nd Ave N
- 4409 2nd Ave N
- 309 46th St N
Your Personal Tour Guide
Ask me questions while you tour the home.