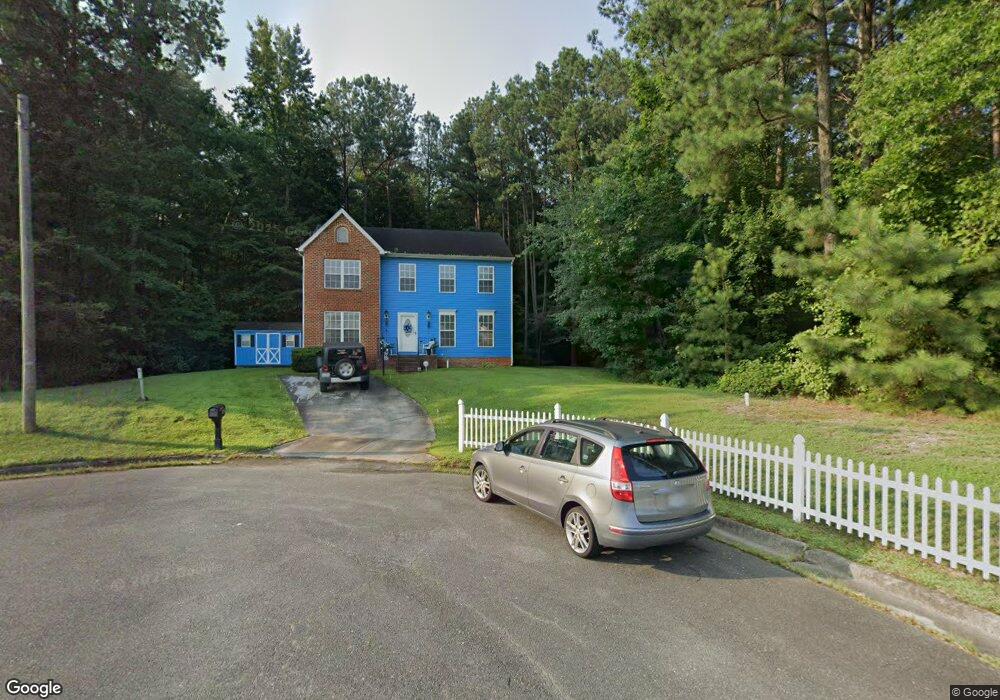
5001 Fernbrook Place Richmond, VA 23224
South Garden NeighborhoodEstimated Value: $168,000 - $367,567
4
Beds
3
Baths
1,922
Sq Ft
$159/Sq Ft
Est. Value
About This Home
This home is located at 5001 Fernbrook Place, Richmond, VA 23224 and is currently estimated at $305,892, approximately $159 per square foot. 5001 Fernbrook Place is a home located in Richmond City with nearby schools including G.H. Reid Elementary School, Open High School, and Huguenot High School.
Ownership History
Date
Name
Owned For
Owner Type
Purchase Details
Closed on
May 28, 2025
Sold by
Garlick Brandon T and Jones James A
Bought by
Asset Properties Llc
Current Estimated Value
Home Financials for this Owner
Home Financials are based on the most recent Mortgage that was taken out on this home.
Original Mortgage
$175,000
Outstanding Balance
$174,551
Interest Rate
6.81%
Mortgage Type
New Conventional
Estimated Equity
$131,341
Purchase Details
Closed on
May 6, 2025
Sold by
Cannon Wallace E
Bought by
Jones James A and Garlick Brandon T
Home Financials for this Owner
Home Financials are based on the most recent Mortgage that was taken out on this home.
Original Mortgage
$175,000
Outstanding Balance
$174,551
Interest Rate
6.81%
Mortgage Type
New Conventional
Estimated Equity
$131,341
Purchase Details
Closed on
Mar 27, 2006
Sold by
Security Holdings
Bought by
Cannon Wallace B
Home Financials for this Owner
Home Financials are based on the most recent Mortgage that was taken out on this home.
Original Mortgage
$161,424
Interest Rate
6.28%
Mortgage Type
FHA
Purchase Details
Closed on
Dec 8, 2004
Sold by
Security Holdings
Bought by
Braxton Brothers Inc
Create a Home Valuation Report for This Property
The Home Valuation Report is an in-depth analysis detailing your home's value as well as a comparison with similar homes in the area
Home Values in the Area
Average Home Value in this Area
Purchase History
| Date | Buyer | Sale Price | Title Company |
|---|---|---|---|
| Asset Properties Llc | $80,000 | Fidelity National Title Insura | |
| Jones James A | $30,000 | Fidelity National Title | |
| Cannon Wallace B | $162,700 | -- | |
| Braxton Brothers Inc | $174,455 | -- |
Source: Public Records
Mortgage History
| Date | Status | Borrower | Loan Amount |
|---|---|---|---|
| Open | Asset Properties Llc | $175,000 | |
| Previous Owner | Cannon Wallace B | $161,424 |
Source: Public Records
Tax History Compared to Growth
Tax History
| Year | Tax Paid | Tax Assessment Tax Assessment Total Assessment is a certain percentage of the fair market value that is determined by local assessors to be the total taxable value of land and additions on the property. | Land | Improvement |
|---|---|---|---|---|
| 2025 | $4,068 | $339,000 | $52,000 | $287,000 |
| 2024 | $3,972 | $331,000 | $52,000 | $279,000 |
| 2023 | $3,420 | $285,000 | $40,000 | $245,000 |
| 2022 | $2,928 | $244,000 | $40,000 | $204,000 |
| 2021 | $2,172 | $190,000 | $30,000 | $160,000 |
| 2020 | $2,172 | $181,000 | $30,000 | $151,000 |
| 2019 | $2,124 | $177,000 | $30,000 | $147,000 |
| 2018 | $2,076 | $173,000 | $30,000 | $143,000 |
| 2017 | $2,052 | $171,000 | $30,000 | $141,000 |
| 2016 | $1,968 | $164,000 | $35,000 | $129,000 |
| 2015 | $2,016 | $168,000 | $35,000 | $133,000 |
| 2014 | $2,016 | $168,000 | $35,000 | $133,000 |
Source: Public Records
Map
Nearby Homes
- 1827 Clarkson Rd
- 1923 Powell Rd
- 2228 Cullen Rd
- 4701 Cooks Rd
- 5018 Orcutt Ln
- 1100 Ridgecliff Dr
- 5018 Burtwood Ln
- 4254 N Kinsley Ave
- 5116 Alberene Rd
- 4216 Sheffield Rd
- 1156 Canterbury Ridge Rd
- 2013 Orlando Rd
- 5425 Burtwood Ln
- 4616 Ferguson Ln
- 2431 Brinkwood Dr
- 2710 Pauls Ln
- 1138 Hodges Rd
- 5331 White Oak Dr
- 841 Rosemont Rd
- 2401 Clearfield St
- 5000 Fernbrook Place
- 5002 Fernbrook Place
- 5003 Fernbrook Place
- 5004 Fernbrook Place
- 5005 Fernbrook Terrace
- 5003 Fernbrook Terrace
- 5006 Fernbrook Place
- 5005 Fernbrook Place
- 5007 Fernbrook Terrace
- 5008 Fernbrook Place
- 5009 Fernbrook Terrace
- 5001 Fernbrook Terrace
- 5007 Fernbrook Place
- 5011 Fernbrook Terrace
- 5013 Fernbrook Terrace
- 5010 Fernbrook Place
- 5000 Fernbrook Terrace
- 5002 Fernbrook Terrace
- 5004 Fernbrook Terrace
- 5009 Fernbrook Place