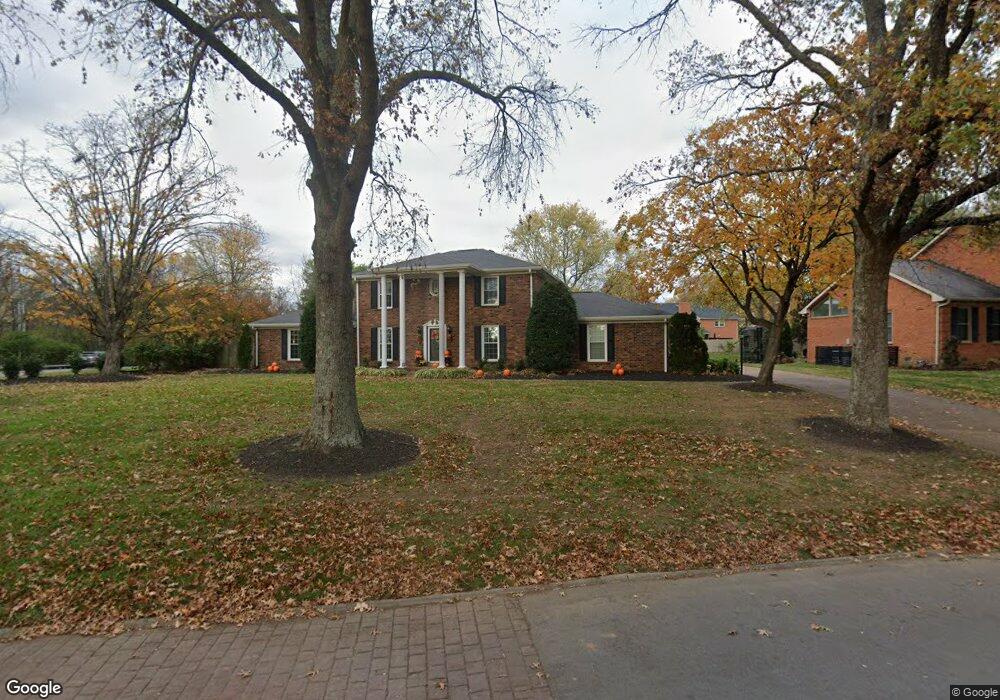
5001 Langford Pass Old Hickory, TN 37138
Estimated Value: $596,000 - $736,000
--
Bed
3
Baths
2,773
Sq Ft
$233/Sq Ft
Est. Value
About This Home
This home is located at 5001 Langford Pass, Old Hickory, TN 37138 and is currently estimated at $645,296, approximately $232 per square foot. 5001 Langford Pass is a home located in Wilson County with nearby schools including Lakeview Elementary School, Mt. Juliet Middle School, and Green Hill High School.
Ownership History
Date
Name
Owned For
Owner Type
Purchase Details
Closed on
Aug 12, 2005
Sold by
Winters David A
Bought by
Richardson Jeffrey S
Current Estimated Value
Home Financials for this Owner
Home Financials are based on the most recent Mortgage that was taken out on this home.
Original Mortgage
$205,600
Outstanding Balance
$109,527
Interest Rate
5.88%
Estimated Equity
$535,769
Purchase Details
Closed on
Aug 8, 2005
Sold by
Winters David A
Bought by
Richardson Jeffrey S
Home Financials for this Owner
Home Financials are based on the most recent Mortgage that was taken out on this home.
Original Mortgage
$205,600
Outstanding Balance
$109,527
Interest Rate
5.88%
Estimated Equity
$535,769
Purchase Details
Closed on
Jan 2, 2002
Sold by
Binkley Clarence A and Binkley Ruth A
Bought by
Winters David A
Purchase Details
Closed on
Apr 30, 1984
Bought by
Binkley Clarence
Create a Home Valuation Report for This Property
The Home Valuation Report is an in-depth analysis detailing your home's value as well as a comparison with similar homes in the area
Home Values in the Area
Average Home Value in this Area
Purchase History
| Date | Buyer | Sale Price | Title Company |
|---|---|---|---|
| Richardson Jeffrey S | $257,000 | -- | |
| Richardson Jeffrey S | $257,000 | -- | |
| Winters David A | $210,000 | -- | |
| Binkley Clarence | -- | -- |
Source: Public Records
Mortgage History
| Date | Status | Borrower | Loan Amount |
|---|---|---|---|
| Open | Binkley Clarence | $205,600 | |
| Closed | Binkley Clarence | $51,400 | |
| Closed | Binkley Clarence | $205,600 | |
| Closed | Binkley Clarence | $51,400 |
Source: Public Records
Tax History Compared to Growth
Tax History
| Year | Tax Paid | Tax Assessment Tax Assessment Total Assessment is a certain percentage of the fair market value that is determined by local assessors to be the total taxable value of land and additions on the property. | Land | Improvement |
|---|---|---|---|---|
| 2024 | $2,104 | $110,200 | $17,500 | $92,700 |
| 2022 | $1,932 | $101,225 | $17,500 | $83,725 |
| 2021 | $1,932 | $101,225 | $17,500 | $83,725 |
| 2020 | $1,910 | $101,225 | $17,500 | $83,725 |
| 2019 | $1,910 | $75,825 | $20,450 | $55,375 |
| 2018 | $1,907 | $75,700 | $20,450 | $55,250 |
| 2017 | $1,907 | $75,700 | $20,450 | $55,250 |
| 2016 | $1,907 | $75,700 | $20,450 | $55,250 |
| 2015 | $1,946 | $75,700 | $20,450 | $55,250 |
| 2014 | $1,771 | $68,902 | $0 | $0 |
Source: Public Records
Map
Nearby Homes
- 208 Lowell Ct
- 5128 Brittany Dr
- 5504 W Shady Trail
- 116 Greenwich Ct
- 5307 E Bend Dr
- 4803 Wayside Dr
- 313 Hollywood Dr
- 4858 Quail Run
- 4826 Quail Hollow Dr
- 4815 Quail Hollow Dr
- 5625 Scenic Ridge Dr
- 290 Brookside Dr
- 0 Rebel Rd
- 231 Green Harbor Rd Unit 69
- 231 Green Harbor Rd Unit 6F
- 231 Green Harbor Rd Unit 44
- 231 Green Harbor Rd Unit 96
- 231 Green Harbor Rd Unit 113A
- 310 Boxbury Ct
- 240 Green Harbor Rd
- 5003 Langford Pass
- 116 Winthrop Place
- 120 Winthrop Place
- 5062 Twin Ridge Dr
- 5005 Langford Pass
- 5000 Langford Pass
- 124 Winthrop Place
- 112 Winthrop Place
- 5002 Langford Pass
- 5061 Twin Ridge Dr
- 5007 Langford Pass
- 5004 Langford Pass
- 5101 Brittany Dr
- 5033 Saundersville Rd
- 108 Winthrop Place
- 104 Winthrop Place
- 128 Winthrop Place
- 5058 Twin Ridge Dr
- 4944 Greenbriar Cir
- 5057 Twin Ridge Dr