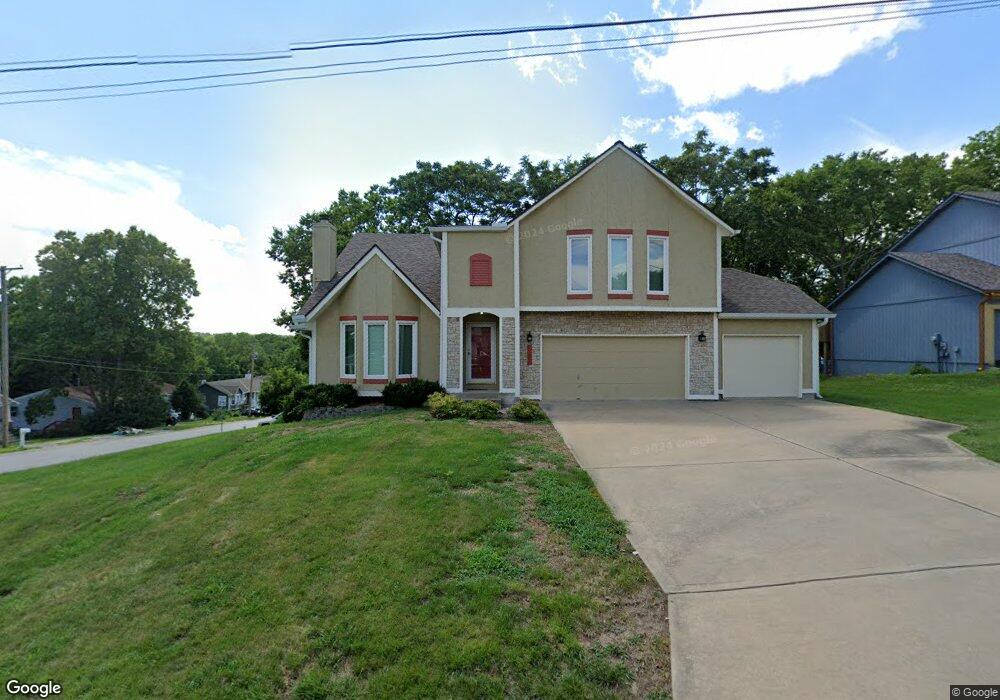
5002 Grandview St Shawnee, KS 66203
Estimated Value: $376,716 - $407,000
3
Beds
3
Baths
1,879
Sq Ft
$208/Sq Ft
Est. Value
About This Home
This home is located at 5002 Grandview St, Shawnee, KS 66203 and is currently estimated at $389,929, approximately $207 per square foot. 5002 Grandview St is a home located in Johnson County with nearby schools including Merriam Park Elementary School, Hocker Grove Middle School, and Shawnee Mission North High School.
Ownership History
Date
Name
Owned For
Owner Type
Purchase Details
Closed on
Mar 28, 2003
Sold by
Coleman Marty R and Coleman Martha M
Bought by
Curtright Kevin D and Curtright Jane A
Current Estimated Value
Home Financials for this Owner
Home Financials are based on the most recent Mortgage that was taken out on this home.
Original Mortgage
$100,000
Outstanding Balance
$42,644
Interest Rate
5.77%
Estimated Equity
$347,285
Purchase Details
Closed on
Nov 18, 2002
Sold by
Coleman Marty R and Coleman Martha M
Bought by
Coleman Marty R and Coleman Martha M
Home Financials for this Owner
Home Financials are based on the most recent Mortgage that was taken out on this home.
Original Mortgage
$168,750
Interest Rate
5.89%
Purchase Details
Closed on
Dec 6, 2001
Sold by
Karl Norman H and Karl Martha A
Bought by
Kelly Construction Llc
Home Financials for this Owner
Home Financials are based on the most recent Mortgage that was taken out on this home.
Original Mortgage
$120,000
Interest Rate
6.39%
Create a Home Valuation Report for This Property
The Home Valuation Report is an in-depth analysis detailing your home's value as well as a comparison with similar homes in the area
Home Values in the Area
Average Home Value in this Area
Purchase History
| Date | Buyer | Sale Price | Title Company |
|---|---|---|---|
| Curtright Kevin D | -- | Chicago Title Insurance Co | |
| Coleman Marty R | -- | Chicago Title Insurance Co | |
| Kelly Construction Llc | -- | Security Land Title Company |
Source: Public Records
Mortgage History
| Date | Status | Borrower | Loan Amount |
|---|---|---|---|
| Open | Curtright Kevin D | $100,000 | |
| Previous Owner | Coleman Marty R | $168,750 | |
| Previous Owner | Kelly Construction Llc | $120,000 |
Source: Public Records
Tax History Compared to Growth
Tax History
| Year | Tax Paid | Tax Assessment Tax Assessment Total Assessment is a certain percentage of the fair market value that is determined by local assessors to be the total taxable value of land and additions on the property. | Land | Improvement |
|---|---|---|---|---|
| 2024 | $4,463 | $41,470 | $5,003 | $36,467 |
| 2023 | $4,053 | $38,514 | $5,003 | $33,511 |
| 2022 | $4,120 | $37,686 | $4,544 | $33,142 |
| 2021 | $3,602 | $31,579 | $4,126 | $27,453 |
| 2020 | $3,350 | $29,175 | $3,591 | $25,584 |
| 2019 | $3,228 | $28,094 | $3,121 | $24,973 |
| 2018 | $3,188 | $27,623 | $2,834 | $24,789 |
| 2017 | $2,860 | $24,472 | $2,834 | $21,638 |
| 2016 | $2,839 | $24,001 | $2,834 | $21,167 |
| 2015 | $2,638 | $22,494 | $2,834 | $19,660 |
| 2013 | -- | $21,586 | $2,834 | $18,752 |
Source: Public Records
Map
Nearby Homes
- 9012 W 49th St
- 9328 W 51st St
- 9201 W 48th Terrace
- 5003 Knox Ave
- 5220 Hayes St
- 4807 Oliver Ct
- 4820 Hadley St
- 9719 W 53rd St
- 8613 W 54th Terrace
- 5517 Hayes St
- 4513 Sutton Ct
- 10116 W 52nd Terrace
- 0 W 49th St
- 4905 Vista St
- 5029 Forest Ave
- 4216 Merriam Dr
- 5405 Oliver St
- 2925 S 52nd St
- 2913 S 52nd St
- 2918 S 52nd Terrace
- 4930 Grandview St
- 9116 W 50th Terrace
- 5005 Grandview St
- 5001 Grandview St
- 9201 W 50th Terrace
- 9203 W 50th Terrace
- 4931 Grandview St
- 4920 Grandview St
- 9023 W 50th Terrace
- 9207 W 50th Terrace
- 9103 W 49th Terrace
- 4927 Grandview St
- 9024 W 50th Terrace
- 9105 W 49th Terrace
- 9021 W 50th Terrace
- 9211 W 50th Terrace
- 9107 W 49th Terrace
- 4923 Grandview St
- 9107 W 49th Terrace
- 9009 W 50th Terrace