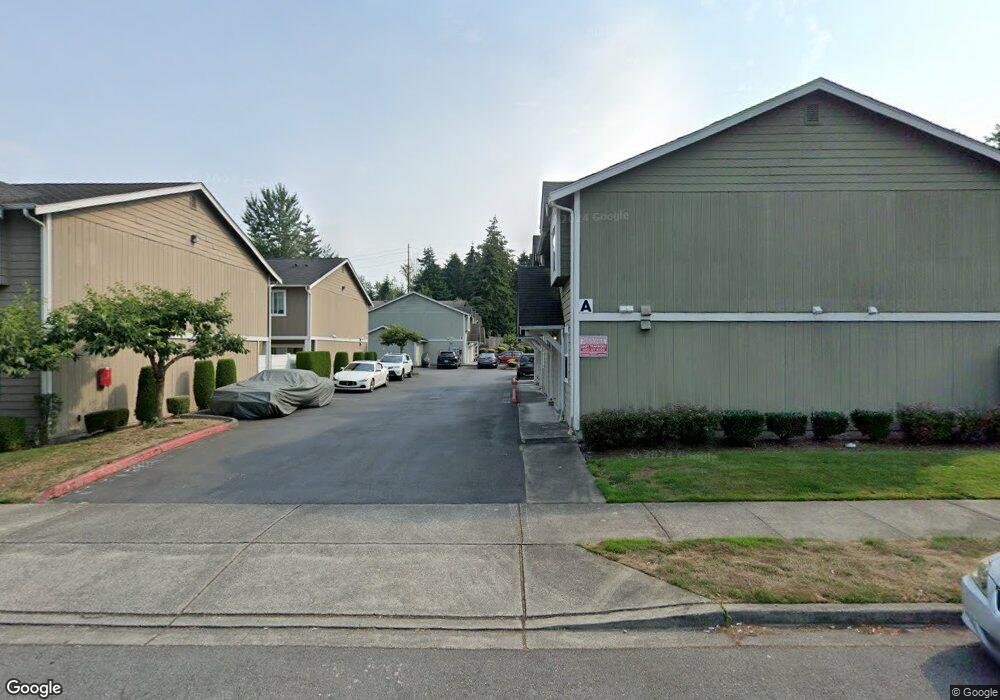
5002 S 30th St Unit G1 Tacoma, WA 98409
South Tacoma NeighborhoodEstimated Value: $295,000 - $316,000
2
Beds
2
Baths
1,034
Sq Ft
$294/Sq Ft
Est. Value
About This Home
This home is located at 5002 S 30th St Unit G1, Tacoma, WA 98409 and is currently estimated at $304,354, approximately $294 per square foot. 5002 S 30th St Unit G1 is a home located in Pierce County with nearby schools including Whittier Elementary School, Wainwright Intermediate School, and Foss High School.
Ownership History
Date
Name
Owned For
Owner Type
Purchase Details
Closed on
Jun 10, 2013
Sold by
Wells Fargo Bank Na
Bought by
Secretary Of Housing & Urban Development
Current Estimated Value
Purchase Details
Closed on
May 1, 2013
Sold by
Phan Thuy
Bought by
Wells Fargo Bank Na
Purchase Details
Closed on
Oct 14, 2008
Sold by
Laxamana Tiffany S and Laxamana Jeffrey C
Bought by
Exum Harvey L
Home Financials for this Owner
Home Financials are based on the most recent Mortgage that was taken out on this home.
Original Mortgage
$132,914
Interest Rate
6.31%
Mortgage Type
FHA
Purchase Details
Closed on
Jun 7, 2007
Sold by
Cherry Orchard Development Llc
Bought by
Laxamana Tiffany S and Laxamana Jeffrey C
Home Financials for this Owner
Home Financials are based on the most recent Mortgage that was taken out on this home.
Original Mortgage
$34,990
Interest Rate
6.16%
Mortgage Type
Credit Line Revolving
Create a Home Valuation Report for This Property
The Home Valuation Report is an in-depth analysis detailing your home's value as well as a comparison with similar homes in the area
Home Values in the Area
Average Home Value in this Area
Purchase History
| Date | Buyer | Sale Price | Title Company |
|---|---|---|---|
| Secretary Of Housing & Urban Development | -- | None Available | |
| Wells Fargo Bank Na | $184,629 | None Available | |
| Exum Harvey L | $135,000 | Attorneys Title | |
| Laxamana Tiffany S | $174,950 | Chicago Title Insurance Co | |
| Cherry Orchard Development Llc | -- | Chicago Title |
Source: Public Records
Mortgage History
| Date | Status | Borrower | Loan Amount |
|---|---|---|---|
| Previous Owner | Exum Harvey L | $132,914 | |
| Previous Owner | Cherry Orchard Development Llc | $34,990 | |
| Previous Owner | Laxamana Tiffany S | $139,960 |
Source: Public Records
Tax History Compared to Growth
Tax History
| Year | Tax Paid | Tax Assessment Tax Assessment Total Assessment is a certain percentage of the fair market value that is determined by local assessors to be the total taxable value of land and additions on the property. | Land | Improvement |
|---|---|---|---|---|
| 2025 | $3,043 | $295,700 | $176,700 | $119,000 |
| 2024 | $3,043 | $298,300 | $170,700 | $127,600 |
| 2023 | $3,043 | $272,900 | $163,300 | $109,600 |
| 2022 | $2,427 | $255,200 | $134,700 | $120,500 |
| 2021 | $2,315 | $183,700 | $73,900 | $109,800 |
| 2019 | $1,908 | $166,500 | $59,500 | $107,000 |
| 2018 | $1,762 | $146,400 | $52,000 | $94,400 |
| 2017 | $1,345 | $111,200 | $32,900 | $78,300 |
| 2016 | $1,115 | $70,000 | $20,800 | $49,200 |
| 2014 | $1,434 | $63,900 | $20,100 | $43,800 |
| 2013 | $1,434 | $53,300 | $16,500 | $36,800 |
Source: Public Records
Map
Nearby Homes
- 106 Holly Ct
- 306 Stanford St
- 445 Buena Vista Ave
- 214 Summit Ave
- 2902 S Monroe St
- 3506 S Tyler St
- 1203 Contra Costa Ave
- 702 Yale St
- 2950 S Proctor St Unit 1
- 3619 S Tyler St
- 3636 S Tyler St
- 3502 S Madison St
- 1310 Boise St Unit 2
- 1324 Boise St
- 3217 S Durango St
- 1813 S Woodlawn St
- 1407 Cherry Ave
- 3226 S Adams St
- 1327 1333 Contra Costa Ave
- 3902 Mason Loop Rd
- 5002 S 30th St Unit E1
- 5002 S 30th St Unit C2
- 5002 S 30th St Unit C3
- 5002 S 30th St Unit H4
- 5002 S 30th St Unit D1
- 5002 S 30th St
- 5002 S 30th St
- 5002 S 30th St Unit H2
- 5002 S 30th St Unit G4
- 5002 S 30th St Unit G3
- 5002 S 30th St Unit F4
- 5002 S 30th St Unit F2
- 5002 S 30th St Unit E3
- 5002 S 30th St Unit E2
- 5002 S 30th St Unit D4
- 5002 S 30th St Unit D3
- 5002 S 30th St Unit D2
- 5002 S 30th St Unit B3