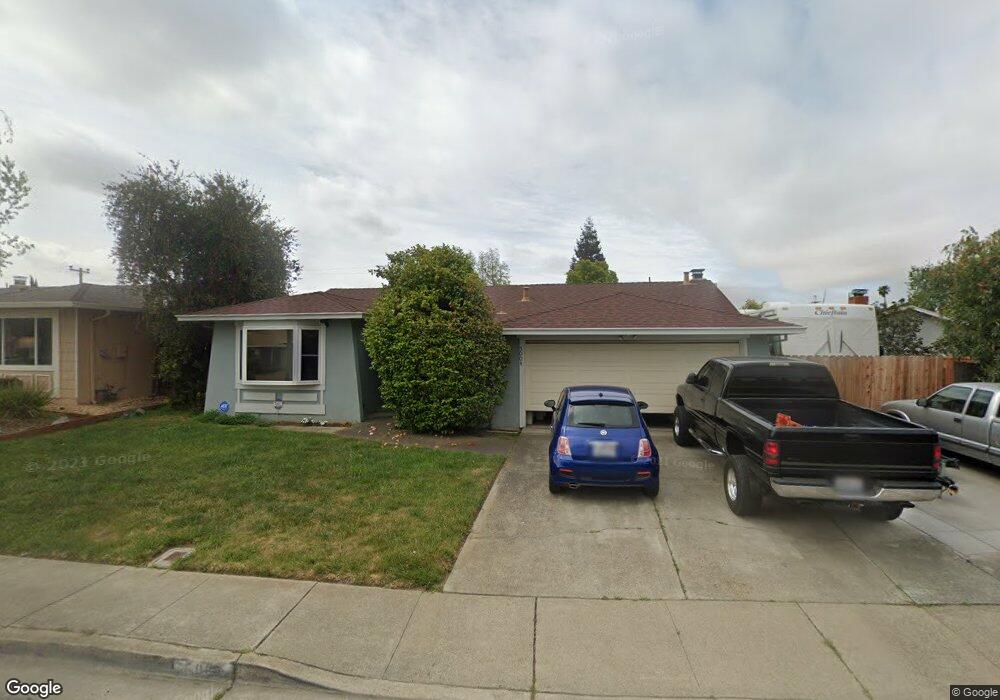
5004 Hutton St Unit 15 Fremont, CA 94538
Blacow NeighborhoodEstimated Value: $1,425,144 - $1,562,000
4
Beds
2
Baths
1,494
Sq Ft
$995/Sq Ft
Est. Value
About This Home
This home is located at 5004 Hutton St Unit 15, Fremont, CA 94538 and is currently estimated at $1,486,786, approximately $995 per square foot. 5004 Hutton St Unit 15 is a home located in Alameda County with nearby schools including Steven Millard Elementary, G.M. Walters Middle School, and John F. Kennedy High School.
Ownership History
Date
Name
Owned For
Owner Type
Purchase Details
Closed on
Jul 28, 2004
Sold by
Meneses Eduardo and Stone Meneses Stephanie L
Bought by
Meneses Eduardo and Stone Meneses Stephanie L
Current Estimated Value
Home Financials for this Owner
Home Financials are based on the most recent Mortgage that was taken out on this home.
Original Mortgage
$322,000
Outstanding Balance
$160,946
Interest Rate
6.12%
Mortgage Type
New Conventional
Estimated Equity
$1,325,840
Purchase Details
Closed on
May 12, 2000
Sold by
Muckel Diane V Stone and Muckel Fred W
Bought by
Meneses Eduardo and Stone Meneses Stephanie Lynn
Home Financials for this Owner
Home Financials are based on the most recent Mortgage that was taken out on this home.
Original Mortgage
$235,000
Interest Rate
8%
Purchase Details
Closed on
Dec 14, 1999
Sold by
Stone Diane V
Bought by
Stone Muckel Diane V and Muckel Fred W
Purchase Details
Closed on
Dec 23, 1996
Sold by
Muckel Fred William
Bought by
Stone Diane V
Create a Home Valuation Report for This Property
The Home Valuation Report is an in-depth analysis detailing your home's value as well as a comparison with similar homes in the area
Home Values in the Area
Average Home Value in this Area
Purchase History
| Date | Buyer | Sale Price | Title Company |
|---|---|---|---|
| Meneses Eduardo | -- | Chicago Title Company | |
| Meneses Eduardo | $117,500 | North American Title Co | |
| Stone Muckel Diane V | -- | -- | |
| Stone Diane V | -- | Chicago Title Co |
Source: Public Records
Mortgage History
| Date | Status | Borrower | Loan Amount |
|---|---|---|---|
| Open | Meneses Eduardo | $322,000 | |
| Closed | Meneses Eduardo | $235,000 |
Source: Public Records
Tax History Compared to Growth
Tax History
| Year | Tax Paid | Tax Assessment Tax Assessment Total Assessment is a certain percentage of the fair market value that is determined by local assessors to be the total taxable value of land and additions on the property. | Land | Improvement |
|---|---|---|---|---|
| 2025 | $1,709 | $79,437 | $21,085 | $58,352 |
| 2024 | $1,709 | $77,879 | $20,671 | $57,208 |
| 2023 | $1,644 | $76,352 | $20,266 | $56,086 |
| 2022 | $1,594 | $74,856 | $19,869 | $54,987 |
| 2021 | $1,563 | $73,388 | $19,479 | $53,909 |
| 2020 | $1,472 | $72,636 | $19,280 | $53,356 |
| 2019 | $1,461 | $71,212 | $18,902 | $52,310 |
| 2018 | $1,430 | $69,815 | $18,531 | $51,284 |
| 2017 | $1,395 | $68,447 | $18,168 | $50,279 |
| 2016 | $1,357 | $67,104 | $17,811 | $49,293 |
| 2015 | $1,325 | $66,097 | $17,544 | $48,553 |
| 2014 | $1,293 | $64,802 | $17,200 | $47,602 |
Source: Public Records
Map
Nearby Homes
- 4744 Bach Ct
- 5624 Chestnut Common
- 5580 Hemlock Terrace
- 4759 Stevenson Blvd
- 5149 Roycroft Way
- 5531 Cosmos Common Unit 116
- 4572 De Silva St
- 40803 Blacow Rd
- 4692 Nelson St
- 5341 Audubon Park Ct
- 4619 Victoria Ave
- 4751 Wadsworth Ct
- 105 Visa Ct
- 4600 Nelson St
- 4453 Porter St
- 40696 Robin St
- 4415 Burney Way
- 4421 Cahill St
- 4350 Millard Ave
- 39857 Pelton Terrace
- 5026 Hutton St
- 40219 Landon Ave
- 5034 Hutton St
- 40241 Landon Ave
- 5023 Brett Ct
- 5031 Brett Ct
- 5042 Hutton St
- 40220 Landon Ave
- 40251 Landon Ave
- 5019 Hutton St
- 5025 Hutton St
- 5022 Brett Ct
- 40240 Landon Ave
- 5050 Hutton St
- 40155 Blacow Rd
- 5039 Brett Ct
- 40261 Landon Ave
- 5037 Hutton St
- 40205 Blacow Rd
- 40260 Landon Ave