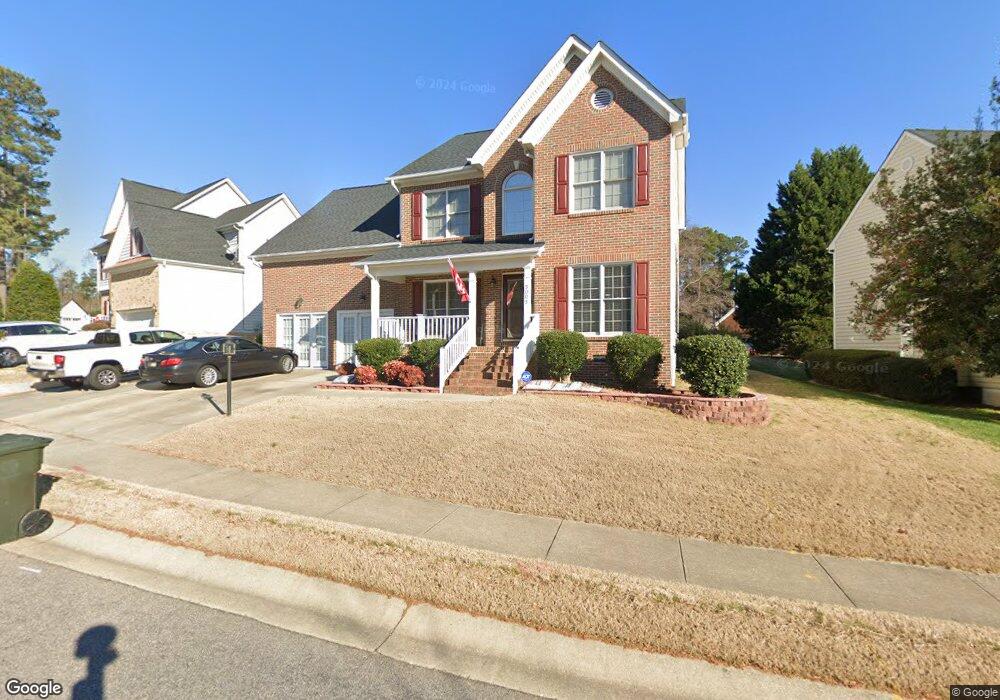
5005 Amberfield Way Raleigh, NC 27604
Northeast Raleigh NeighborhoodEstimated Value: $433,000 - $485,000
3
Beds
3
Baths
2,450
Sq Ft
$187/Sq Ft
Est. Value
About This Home
This home is located at 5005 Amberfield Way, Raleigh, NC 27604 and is currently estimated at $459,050, approximately $187 per square foot. 5005 Amberfield Way is a home located in Wake County with nearby schools including Beaverdam Elementary School, River Bend Middle, and Rolesville High School.
Ownership History
Date
Name
Owned For
Owner Type
Purchase Details
Closed on
Jan 21, 2009
Sold by
U S Bank National Association
Bought by
Lankster Thomas J and Lankster Valerie
Current Estimated Value
Purchase Details
Closed on
Oct 9, 2008
Sold by
Johnson Charles W and Johnson Pamela L
Bought by
U S Bank National Association
Purchase Details
Closed on
Oct 31, 2006
Sold by
Darden Johnnie and Darden Freda D
Bought by
Johnson Charles W and Johnson Pamela L
Home Financials for this Owner
Home Financials are based on the most recent Mortgage that was taken out on this home.
Original Mortgage
$46,980
Interest Rate
6.31%
Mortgage Type
Stand Alone Second
Purchase Details
Closed on
Jun 17, 2002
Sold by
St Lawrence Homes Inc
Bought by
Darden Johnnie and Darden Freda D
Home Financials for this Owner
Home Financials are based on the most recent Mortgage that was taken out on this home.
Original Mortgage
$163,200
Interest Rate
5.37%
Create a Home Valuation Report for This Property
The Home Valuation Report is an in-depth analysis detailing your home's value as well as a comparison with similar homes in the area
Home Values in the Area
Average Home Value in this Area
Purchase History
| Date | Buyer | Sale Price | Title Company |
|---|---|---|---|
| Lankster Thomas J | $172,500 | None Available | |
| U S Bank National Association | $216,928 | None Available | |
| Johnson Charles W | $235,000 | None Available | |
| Darden Johnnie | $204,000 | -- |
Source: Public Records
Mortgage History
| Date | Status | Borrower | Loan Amount |
|---|---|---|---|
| Previous Owner | Johnson Charles W | $46,980 | |
| Previous Owner | Johnson Charles W | $187,920 | |
| Previous Owner | Darden Johnnie | $163,200 | |
| Closed | Darden Johnnie | $40,800 |
Source: Public Records
Tax History Compared to Growth
Tax History
| Year | Tax Paid | Tax Assessment Tax Assessment Total Assessment is a certain percentage of the fair market value that is determined by local assessors to be the total taxable value of land and additions on the property. | Land | Improvement |
|---|---|---|---|---|
| 2025 | -- | $440,336 | $90,000 | $350,336 |
| 2024 | $3,844 | $440,336 | $90,000 | $350,336 |
| 2023 | $3,115 | $283,971 | $40,000 | $243,971 |
| 2022 | $2,895 | $283,971 | $40,000 | $243,971 |
| 2021 | $2,783 | $283,971 | $40,000 | $243,971 |
| 2020 | $2,402 | $249,406 | $40,000 | $209,406 |
| 2019 | $2,181 | $186,462 | $35,000 | $151,462 |
| 2018 | $2,057 | $186,462 | $35,000 | $151,462 |
| 2017 | $1,960 | $186,462 | $35,000 | $151,462 |
| 2016 | $0 | $186,462 | $35,000 | $151,462 |
| 2015 | -- | $213,848 | $40,000 | $173,848 |
| 2014 | -- | $213,848 | $40,000 | $173,848 |
Source: Public Records
Map
Nearby Homes
- 5121 Amberfield Way
- 4913 Knightsbridge Way
- 4905 Knightsbridge Way
- 2712 Kempsford Place
- 511 Edgecreek Ct
- 2401 Laurel Valley Way
- 4412 Birmingham Way
- 4948 Southern Magnolia Dr
- 2704 Rockbridge Ct
- 2301 Laurel Valley Way
- 4309 Birmingham Way
- 2509 Westham Place
- 4400 Knightsbridge Way
- 4656 Forest Highland Dr
- 2037 Summer Shire Way
- 4608 Dresden Village Dr
- 4608 Mowbray Dr
- 2109 Woodwyck Way
- 2761 Andover Glen Rd
- 3017 Barnsley Ln
- 5009 Amberfield Way
- 5001 Amberfield Way
- 5013 Amberfield Way
- 5008 Amberfield Way
- 5004 Amberfield Way
- 5012 Amberfield Way
- 3008 Southall Rd
- 3008 Southall Rd Unit 212
- 5000 Amberfield Way
- 5017 Amberfield Way
- 5016 Amberfield Way
- 3110 Southall Rd
- 5020 Amberfield Way
- 5025 Amberfield Way
- 3096 Southall Rd
- 5024 Amberfield Way
- 5029 Amberfield Way
- 3129 Rocky Brook Crossing
- 3026 Southall Rd
- 3025 Southall Rd