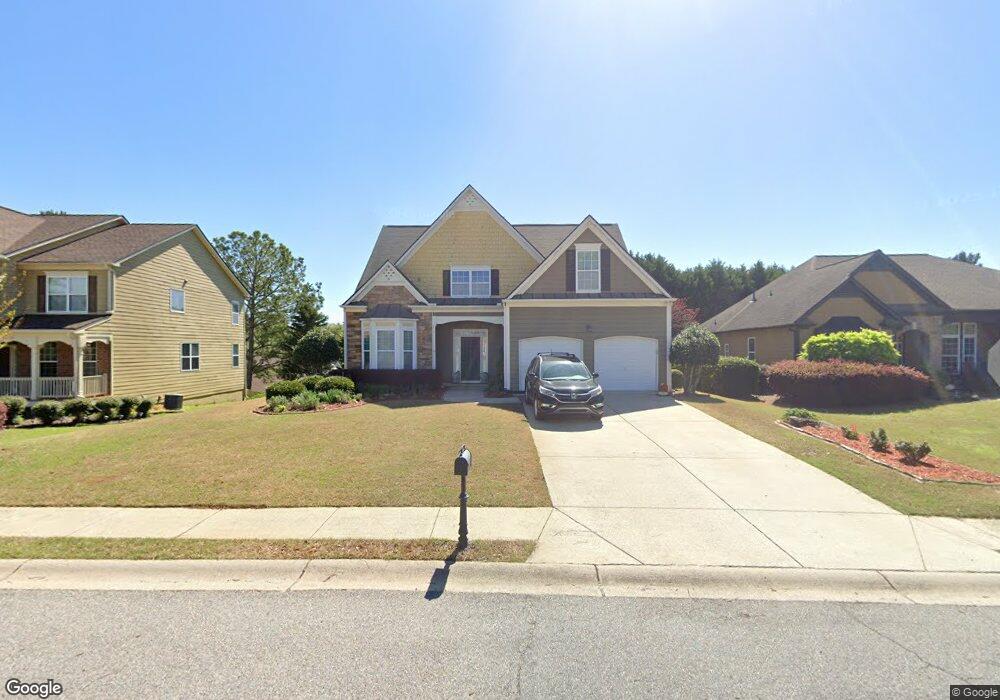
5005 Fieldstone View Cir Cumming, GA 30028
Estimated Value: $486,150 - $517,000
3
Beds
3
Baths
2,959
Sq Ft
$168/Sq Ft
Est. Value
About This Home
This home is located at 5005 Fieldstone View Cir, Cumming, GA 30028 and is currently estimated at $497,788, approximately $168 per square foot. 5005 Fieldstone View Cir is a home located in Forsyth County with nearby schools including Silver City Elementary School, North Forsyth Middle School, and North Forsyth High School.
Ownership History
Date
Name
Owned For
Owner Type
Purchase Details
Closed on
Jul 26, 2022
Sold by
Delong Elizabeth
Bought by
Hunt Sarah A
Current Estimated Value
Purchase Details
Closed on
Dec 31, 2018
Sold by
Hunt Kristine
Bought by
Cook Elizabeth
Purchase Details
Closed on
Aug 8, 2008
Sold by
Weis Carl
Bought by
Weis-Hunt Kristine
Home Financials for this Owner
Home Financials are based on the most recent Mortgage that was taken out on this home.
Original Mortgage
$75,000
Interest Rate
6.01%
Mortgage Type
New Conventional
Purchase Details
Closed on
Mar 9, 2005
Sold by
D R Horton Inc
Bought by
Weis Betty L and Weis Carl
Home Financials for this Owner
Home Financials are based on the most recent Mortgage that was taken out on this home.
Original Mortgage
$89,900
Interest Rate
5.6%
Mortgage Type
New Conventional
Create a Home Valuation Report for This Property
The Home Valuation Report is an in-depth analysis detailing your home's value as well as a comparison with similar homes in the area
Home Values in the Area
Average Home Value in this Area
Purchase History
| Date | Buyer | Sale Price | Title Company |
|---|---|---|---|
| Hunt Sarah A | -- | None Listed On Document | |
| Hunt Sarah A | -- | None Listed On Document | |
| Cook Elizabeth | -- | -- | |
| Weis-Hunt Kristine | -- | -- | |
| Weis Betty L | $189,900 | -- |
Source: Public Records
Mortgage History
| Date | Status | Borrower | Loan Amount |
|---|---|---|---|
| Previous Owner | Weis-Hunt Kristine | $75,000 | |
| Previous Owner | Weis Betty L | $89,900 |
Source: Public Records
Tax History Compared to Growth
Tax History
| Year | Tax Paid | Tax Assessment Tax Assessment Total Assessment is a certain percentage of the fair market value that is determined by local assessors to be the total taxable value of land and additions on the property. | Land | Improvement |
|---|---|---|---|---|
| 2025 | $4,490 | $197,756 | $54,000 | $143,756 |
| 2024 | $4,490 | $183,120 | $52,000 | $131,120 |
| 2023 | $4,319 | $175,476 | $38,000 | $137,476 |
| 2022 | $3,609 | $116,080 | $18,000 | $98,080 |
| 2021 | $3,205 | $116,080 | $18,000 | $98,080 |
| 2020 | $3,010 | $109,016 | $18,000 | $91,016 |
| 2019 | $650 | $107,272 | $18,000 | $89,272 |
| 2018 | $653 | $102,288 | $18,000 | $84,288 |
| 2017 | $2,465 | $93,736 | $18,000 | $75,736 |
| 2016 | $2,229 | $83,456 | $15,200 | $68,256 |
| 2015 | $2,410 | $90,936 | $15,200 | $75,736 |
| 2014 | $1,972 | $77,792 | $12,000 | $65,792 |
Source: Public Records
Map
Nearby Homes
- 4950 Fieldstone View Cir
- 5040 Fieldstone Bend Dr Unit 1
- 4810 Hopewell Manor Dr
- 4720 Montane St
- 4730 Montane St
- 5030 Mundy Dr
- 5260 Fieldgate Ridge Dr
- Shelby Plan at Hopewell Reserve
- Emerson Plan at Hopewell Reserve
- Canton II Plan at Hopewell Reserve
- Riverside Plan at Hopewell Reserve
- 5415 Fieldfreen Dr
- 5340 Mundy Ct
- 4830 Montane St
- 4840 Montane St
- 4835 Montane St
- 5270 Mundy Ct
- 4845 Montane St
- 5315 Hopewell Manor Dr
- 4855 Montane St
- 4995 Fieldstone View Cir Unit 48
- 4995 Fieldstone View Cir
- 5015 Fieldstone View Cir
- 4940 Fieldstone Bend Dr
- 4985 Fieldstone View Cir
- 5025 Fieldstone View Cir
- 4930 Fieldstone Bend Dr
- 4950 Fieldstone Bend Dr
- 5010 Fieldstone View Cir
- 4990 Fieldstone View Cir
- 4920 Fieldstone Bend Dr
- 5055 Fieldstone View Cir
- 5020 Fieldstone View Cir
- 4960 Fieldstone Bend Dr
- 4955 Fieldstone View Cir
- 4980 Fieldstone View Cir
- 5075 Fieldstone View Cir
- 4860 Hopewell Rd
- 4925 Fieldstone Bend Dr
- 5030 Fieldstone View Cir