5005 Maxwell Cir Unit 202 Naples, FL 34105
Moorings Park-Hawks Ridge NeighborhoodEstimated Value: $584,000 - $788,000
3
Beds
3
Baths
2,591
Sq Ft
$274/Sq Ft
Est. Value
About This Home
This home is located at 5005 Maxwell Cir Unit 202, Naples, FL 34105 and is currently estimated at $710,114, approximately $274 per square foot. 5005 Maxwell Cir Unit 202 is a home located in Collier County with nearby schools including Osceola Elementary School, Pine Ridge Middle School, and Barron Collier High School.
Ownership History
Date
Name
Owned For
Owner Type
Purchase Details
Closed on
Nov 16, 2016
Sold by
Hansen Courtney Jane
Bought by
Smallwood Allen Hayes
Current Estimated Value
Purchase Details
Closed on
May 3, 2015
Sold by
Levalley Jordyn Christine and Hansen Jordyn Christine
Bought by
Hansen Courtney Jane
Purchase Details
Closed on
Jul 31, 2006
Sold by
Kruger Linda M
Bought by
Hansen Jordyn Christine and Hansen Courtney Jane
Home Financials for this Owner
Home Financials are based on the most recent Mortgage that was taken out on this home.
Original Mortgage
$55,000
Interest Rate
10%
Mortgage Type
Balloon
Purchase Details
Closed on
Jul 2, 2002
Sold by
Banyan Woods L L C
Bought by
Kruger Linda M
Home Financials for this Owner
Home Financials are based on the most recent Mortgage that was taken out on this home.
Original Mortgage
$150,000
Interest Rate
6.75%
Create a Home Valuation Report for This Property
The Home Valuation Report is an in-depth analysis detailing your home's value as well as a comparison with similar homes in the area
Home Values in the Area
Average Home Value in this Area
Purchase History
| Date | Buyer | Sale Price | Title Company |
|---|---|---|---|
| Smallwood Allen Hayes | $490,000 | None Available | |
| Hansen Courtney Jane | -- | Attorney | |
| Hansen Jordyn Christine | $575,000 | Naples Title | |
| Kruger Linda M | $310,000 | -- |
Source: Public Records
Mortgage History
| Date | Status | Borrower | Loan Amount |
|---|---|---|---|
| Previous Owner | Hansen Jordyn Christine | $55,000 | |
| Previous Owner | Kruger Linda M | $150,000 |
Source: Public Records
Tax History
| Year | Tax Paid | Tax Assessment Tax Assessment Total Assessment is a certain percentage of the fair market value that is determined by local assessors to be the total taxable value of land and additions on the property. | Land | Improvement |
|---|---|---|---|---|
| 2025 | $5,582 | $573,564 | -- | $573,564 |
| 2024 | $5,608 | $508,699 | -- | -- |
| 2023 | $5,608 | $462,454 | $0 | $0 |
| 2022 | $5,158 | $420,413 | $0 | $0 |
| 2021 | $4,399 | $382,194 | $0 | $382,194 |
| 2020 | $4,353 | $382,194 | $0 | $382,194 |
| 2019 | $4,380 | $382,194 | $0 | $382,194 |
| 2018 | $4,376 | $382,922 | $0 | $382,922 |
| 2017 | $4,348 | $377,740 | $0 | $377,740 |
| 2016 | $3,880 | $336,830 | $0 | $0 |
| 2015 | $3,791 | $323,875 | $0 | $0 |
| 2014 | $3,826 | $323,875 | $0 | $0 |
Source: Public Records
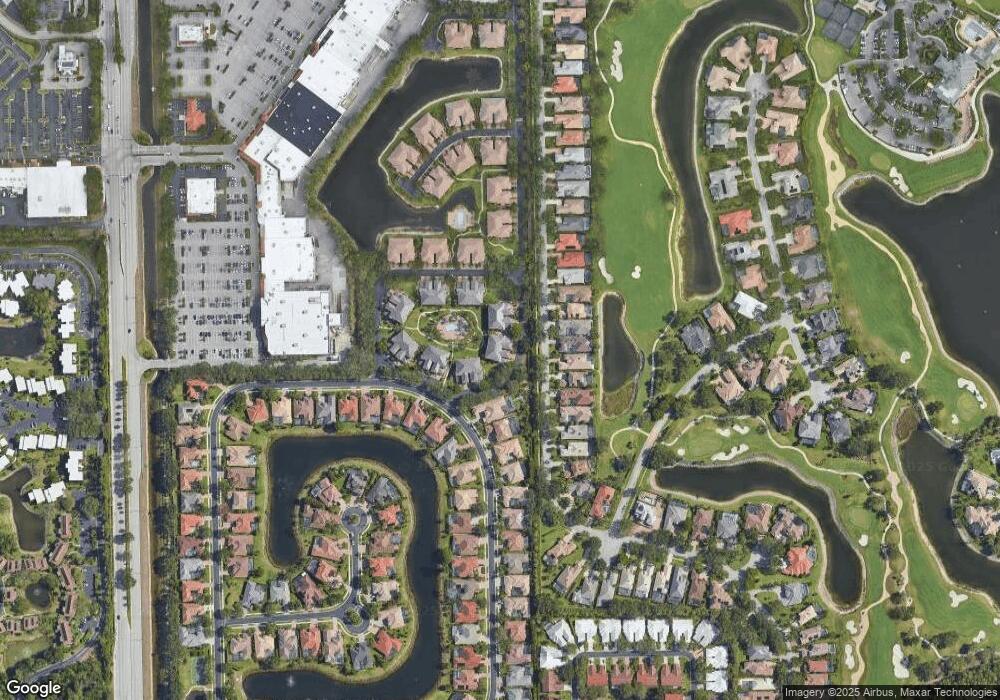
Map
Nearby Homes
- 4980 Rustic Oaks Cir
- 5045 Blauvelt Way Unit 201
- 5030 Blauvelt Way Unit 202
- 5025 Blauvelt Way Unit 202
- 4971 Rustic Oaks Cir
- 4967 Rustic Oaks Cir
- 4963 Rustic Oaks Cir
- 4910 Europa Dr
- 5242 Kensington High St
- 4854 Europa Dr
- 5074 Rustic Oaks Cir
- 1810 Bald Eagle Dr Unit A
- 1830 Bald Eagle Dr Unit 431A
- 4850 Europa Dr
- 406 Meadowlark Ln Unit 406A
- 5073 Kensington High St
- 4908 Rustic Oaks Cir
- 1890 Bald Eagle Dr #B Dr Unit 400B
- 1724 Bald Eagle Dr Unit 512C
- 3408 Timberwood Cir Unit 136-0
- 5005 Maxwell Cir Unit 102
- 5005 Maxwell Cir Unit 7-202
- 5005 Maxwell Cir Unit 7-102
- 5005 Maxwell Cir Unit 201
- 5005 Maxwell Cir
- 5005 Maxwell Cir Unit 101
- 5005 Maxwell Cir
- 5005 Maxwell Cir Unit 7-201
- 5009 Maxwell Cir Unit 6-202
- 5009 Maxwell Cir Unit 6-201
- 5009 Maxwell Cir Unit 6-101
- 5009 Maxwell Cir Unit 201
- 5009 Maxwell Cir
- 5009 Maxwell Cir Unit 101
- 5009 Maxwell Cir Unit 202
- 5001 Maxwell Cir Unit 8-101
- 5001 Maxwell Cir Unit 201
- 5001 Maxwell Cir Unit 102
- 5001 Maxwell Cir
- 5001 Maxwell Cir
Your Personal Tour Guide
Ask me questions while you tour the home.