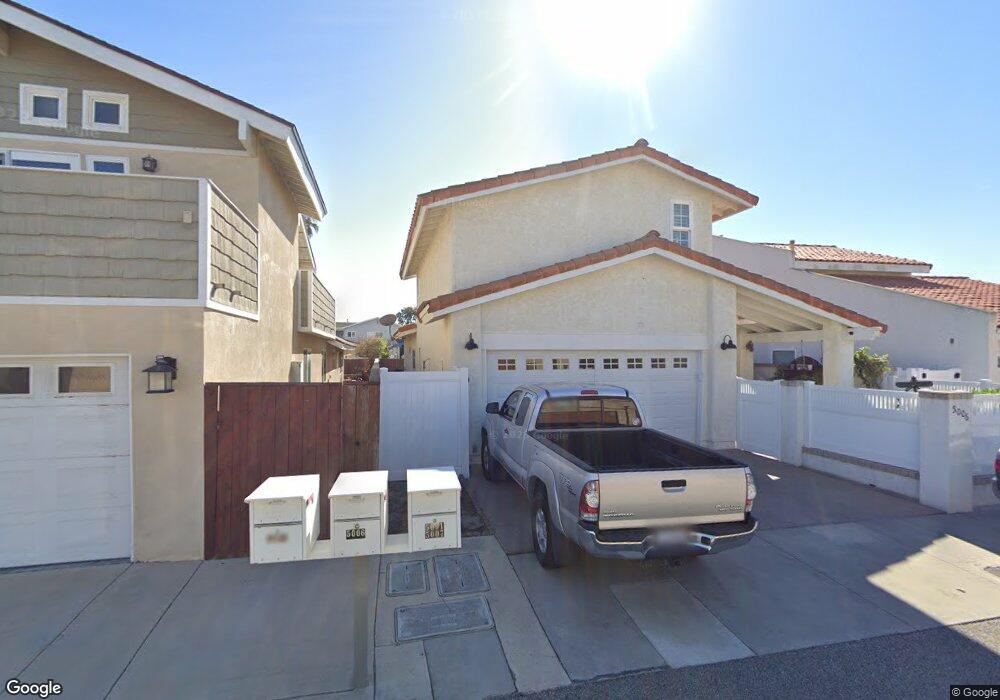
5006 Sealane Way Oxnard, CA 93035
Oxnard Shores NeighborhoodEstimated Value: $1,212,000 - $1,488,000
About This Home
This home is located at 5006 Sealane Way, Oxnard, CA 93035 and is currently estimated at $1,373,571, approximately $733 per square foot. 5006 Sealane Way is a home located in Ventura County with nearby schools including Christa Mcauliffe Elementary School and Oxnard High School.
Ownership History
We collect this data history from publicly available records. To have your information removed, we recommend requesting removal directly through your county’s website.
Purchase Details
Home Financials for this Owner
Home Financials are based on the most recent Mortgage that was taken out on this home.Purchase Details
Home Financials for this Owner
Home Financials are based on the most recent Mortgage that was taken out on this home.Purchase Details
Purchase Details
Home Values in the Area
Average Home Value in this Area
Purchase History
We collect this data history from publicly available records. To have your information removed, we recommend requesting removal directly through your county’s website.
| Date | Buyer | Sale Price | Title Company |
|---|---|---|---|
| -- | Fidelity National Title Co | ||
| $289,000 | American Title Co | ||
| -- | -- | ||
| $201,000 | Continental Lawyers Title Co |
Mortgage History
We collect this data history from publicly available records. To have your information removed, we recommend requesting removal directly through your county’s website.
| Date | Status | Borrower | Loan Amount |
|---|---|---|---|
| Open | $255,000 | ||
| Closed | $227,000 |
Tax History
We collect this data history from publicly available records. To have your information removed, we recommend requesting removal directly through your county’s website.
| Year | Tax Paid | Tax Assessment Tax Assessment Total Assessment is a certain percentage of the fair market value that is determined by local assessors to be the total taxable value of land and additions on the property. | Land | Improvement |
|---|---|---|---|---|
| 2025 | $5,413 | $453,038 | $266,500 | $186,538 |
| 2024 | $5,413 | $444,155 | $261,274 | $182,881 |
| 2023 | $5,214 | $435,447 | $256,151 | $179,296 |
| 2022 | $5,055 | $426,909 | $251,128 | $175,781 |
| 2021 | $5,013 | $418,539 | $246,204 | $172,335 |
| 2020 | $5,106 | $414,250 | $243,681 | $170,569 |
| 2019 | $4,960 | $406,128 | $238,903 | $167,225 |
| 2018 | $4,889 | $398,166 | $234,219 | $163,947 |
| 2017 | $4,638 | $390,360 | $229,627 | $160,733 |
| 2016 | $4,474 | $382,707 | $225,125 | $157,582 |
| 2015 | $4,520 | $376,961 | $221,745 | $155,216 |
| 2014 | $4,469 | $369,579 | $217,402 | $152,177 |
Map
- 4935 Coral Way
- 5010 Terramar Way
- 4949 Nautilus St Unit B
- 1230 Mandalay Beach Rd
- 1068 Canal St
- 4841 Island View St
- 5003 Island View St
- 4818 Island View St
- 5114 Marlin Way
- 1130 Mandalay Beach Rd
- 5040 Island View St
- 1211 Capri Way
- 1135 Capri Way
- 4901 Catamaran St
- 5121 Seabreeze Way
- 833 Dunes St
- 1315 Bayside Cir
- 5331 Wavecrest Way
- 1337 Bayside Cir
- 4340 Tradewinds Dr
- 5000 Sealane Way
- 5012 Sealane Way
- 5018 Sealane Way
- 4907 Coral Way
- 4901 Coral Way
- 4915 Coral Way
- 5024 Sealane Way
- 5007 Sealane Way
- 5013 Sealane Way
- 4921 Coral Way
- 5001 Sealane Way
- 5021 Sealane Way
- 5030 Sealane Way
- 4927 Coral Way
- 5027 Sealane Way
- 5036 Sealane Way
- 5033 Sealane Way
- 4911 Nautilus St Unit F
- 4911 Nautilus St
- 4941 Coral Way
Ask me questions while you tour the home.