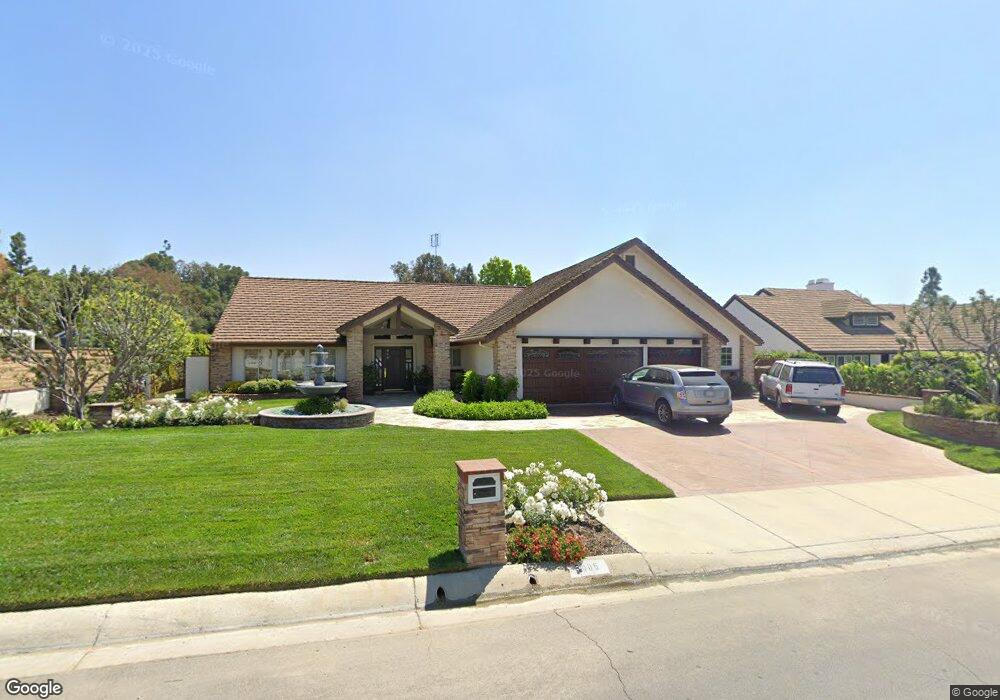
5006 Via Diego Yorba Linda, CA 92887
Estimated Value: $1,930,000 - $2,378,000
3
Beds
5
Baths
3,262
Sq Ft
$637/Sq Ft
Est. Value
About This Home
This home is located at 5006 Via Diego, Yorba Linda, CA 92887 and is currently estimated at $2,076,874, approximately $636 per square foot. 5006 Via Diego is a home located in Orange County with nearby schools including Travis Ranch Middle School, Ivycrest Montessori Private School - Yorba Linda, and Friends Christian School.
Ownership History
Date
Name
Owned For
Owner Type
Purchase Details
Closed on
Jun 4, 2002
Sold by
Schulze David
Bought by
Halpin Mike J and Riley Judy E
Current Estimated Value
Home Financials for this Owner
Home Financials are based on the most recent Mortgage that was taken out on this home.
Original Mortgage
$659,250
Outstanding Balance
$276,379
Interest Rate
6.69%
Estimated Equity
$1,800,495
Purchase Details
Closed on
Dec 9, 1998
Sold by
Schulze Victoria L
Bought by
Schulze David S
Home Financials for this Owner
Home Financials are based on the most recent Mortgage that was taken out on this home.
Original Mortgage
$227,150
Interest Rate
6.78%
Purchase Details
Closed on
Nov 13, 1998
Sold by
Cummings Finnie A and Cummings Patricia O
Bought by
Schulze David
Home Financials for this Owner
Home Financials are based on the most recent Mortgage that was taken out on this home.
Original Mortgage
$227,150
Interest Rate
6.78%
Create a Home Valuation Report for This Property
The Home Valuation Report is an in-depth analysis detailing your home's value as well as a comparison with similar homes in the area
Home Values in the Area
Average Home Value in this Area
Purchase History
| Date | Buyer | Sale Price | Title Company |
|---|---|---|---|
| Halpin Mike J | $879,000 | Chicago Title Co | |
| Schulze David S | -- | North American Title | |
| Schulze David | $469,000 | North American Title Co |
Source: Public Records
Mortgage History
| Date | Status | Borrower | Loan Amount |
|---|---|---|---|
| Open | Halpin Mike J | $659,250 | |
| Previous Owner | Schulze David | $227,150 |
Source: Public Records
Tax History Compared to Growth
Tax History
| Year | Tax Paid | Tax Assessment Tax Assessment Total Assessment is a certain percentage of the fair market value that is determined by local assessors to be the total taxable value of land and additions on the property. | Land | Improvement |
|---|---|---|---|---|
| 2025 | $14,218 | $1,273,079 | $745,207 | $527,872 |
| 2024 | $14,218 | $1,248,117 | $730,595 | $517,522 |
| 2023 | $13,907 | $1,223,645 | $716,270 | $507,375 |
| 2022 | $13,483 | $1,199,652 | $702,225 | $497,427 |
| 2021 | $13,179 | $1,176,130 | $688,456 | $487,674 |
| 2020 | $13,081 | $1,164,071 | $681,397 | $482,674 |
| 2019 | $12,583 | $1,141,247 | $668,037 | $473,210 |
| 2018 | $12,472 | $1,118,870 | $654,938 | $463,932 |
| 2017 | $12,250 | $1,096,932 | $642,096 | $454,836 |
| 2016 | $12,000 | $1,075,424 | $629,506 | $445,918 |
| 2015 | $11,904 | $1,059,271 | $620,051 | $439,220 |
| 2014 | $11,472 | $1,038,522 | $607,905 | $430,617 |
Source: Public Records
Map
Nearby Homes
- 20709 Calle Pera
- 20660 Calle Feliz
- 20681 Via Amarilla
- 5317 Via Ramon Rd
- 4811 Rideline Rd
- 21620 Brisbane Way
- 21417 Zaca Ct
- 21590 Via Pepita
- 20640 Smoketree Ave
- 21630 Dunrobin Way
- 21451 Cloud Ridge
- 5505 Calle Vista Linda
- 5795 Via Perla
- 20455 Via Cadiz
- 4710 Avenida Del Este
- 5851 Via Santana
- 5000 Stonehaven Dr
- 4152 Beech Ave
- 4418 Avenida Del Este
- 4832 Via Frondosa
- 4956 Via Diego
- 5046 Via Diego
- 21069 Via Francisco
- 5100 Via Diego
- 4916 Via Diego
- 21068 Via Toledo
- 21063 Via Francisco
- 21068 Via Francisco
- 5104 Via Diego
- 21064 Via Toledo
- 21075 Via Toledo
- 5102 Via Estancia
- 21071 Via Toledo
- 21059 Via Francisco
- 21065 Via Toledo
- 5104 Via Estancia
- 21058 Via Toledo
- 21061 Via Toledo
- 5105 Via Diego
- 21053 Via Francisco