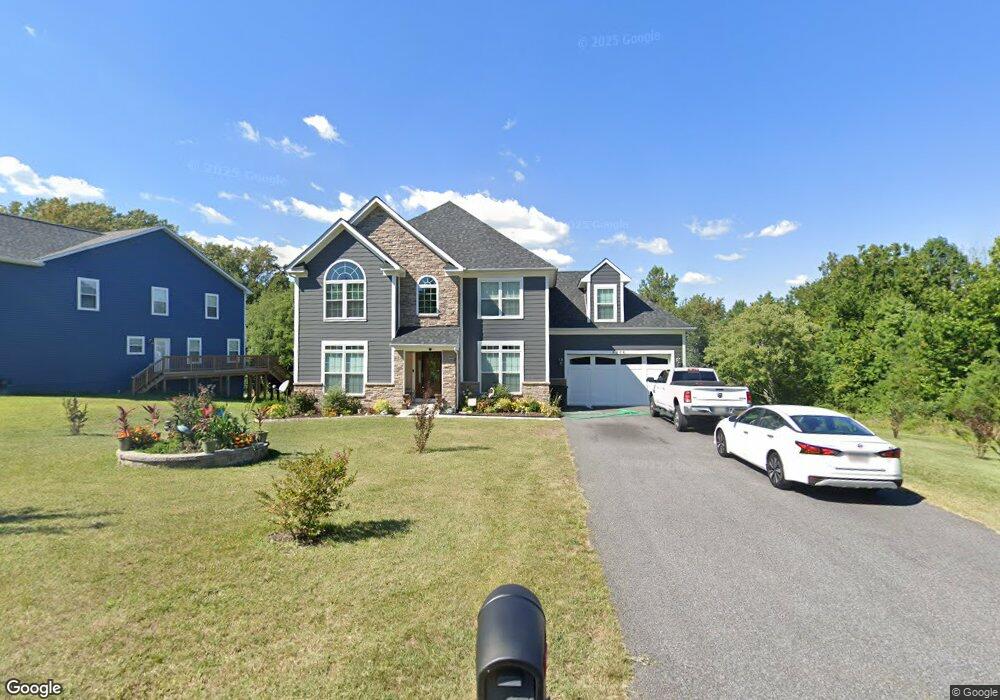
5006 White Marsh Rd Rosedale, MD 21237
Estimated Value: $600,000 - $735,000
--
Bed
--
Bath
3,144
Sq Ft
$219/Sq Ft
Est. Value
About This Home
This home is located at 5006 White Marsh Rd, Rosedale, MD 21237 and is currently estimated at $690,073, approximately $219 per square foot. 5006 White Marsh Rd is a home located in Baltimore County with nearby schools including Parkville Middle & Center of Technology, Overlea High School, and St. Joseph School - Fullerton.
Ownership History
Date
Name
Owned For
Owner Type
Purchase Details
Closed on
Nov 1, 2018
Sold by
White Marsh Development Llc
Bought by
Tennessee Debbra E and Tennessee Leonard
Current Estimated Value
Home Financials for this Owner
Home Financials are based on the most recent Mortgage that was taken out on this home.
Original Mortgage
$461,029
Outstanding Balance
$406,933
Interest Rate
4.99%
Mortgage Type
FHA
Estimated Equity
$283,140
Purchase Details
Closed on
Feb 16, 2016
Sold by
Makres George and Makres Chrisanthe
Bought by
White Marsh Development Llc
Home Financials for this Owner
Home Financials are based on the most recent Mortgage that was taken out on this home.
Original Mortgage
$122,000
Interest Rate
3.81%
Mortgage Type
Future Advance Clause Open End Mortgage
Create a Home Valuation Report for This Property
The Home Valuation Report is an in-depth analysis detailing your home's value as well as a comparison with similar homes in the area
Home Values in the Area
Average Home Value in this Area
Purchase History
| Date | Buyer | Sale Price | Title Company |
|---|---|---|---|
| Tennessee Debbra E | $490,380 | Lawyers Trust Title Co | |
| White Marsh Development Llc | $130,000 | Lawyers Trust Title Company |
Source: Public Records
Mortgage History
| Date | Status | Borrower | Loan Amount |
|---|---|---|---|
| Open | Tennessee Debbra E | $461,029 | |
| Previous Owner | White Marsh Development Llc | $122,000 |
Source: Public Records
Tax History Compared to Growth
Tax History
| Year | Tax Paid | Tax Assessment Tax Assessment Total Assessment is a certain percentage of the fair market value that is determined by local assessors to be the total taxable value of land and additions on the property. | Land | Improvement |
|---|---|---|---|---|
| 2025 | $7,978 | $640,767 | -- | -- |
| 2024 | $7,978 | $576,833 | $0 | $0 |
| 2023 | $3,557 | $512,900 | $97,200 | $415,700 |
| 2022 | $7,038 | $503,667 | $0 | $0 |
| 2021 | $6,926 | $494,433 | $0 | $0 |
| 2020 | $6,990 | $485,200 | $97,200 | $388,000 |
| 2019 | $5,747 | $474,200 | $0 | $0 |
| 2018 | $1,682 | $463,200 | $0 | $0 |
| 2017 | $1,324 | $97,200 | $0 | $0 |
| 2016 | -- | $97,200 | $0 | $0 |
| 2015 | -- | $97,200 | $0 | $0 |
| 2014 | -- | $97,200 | $0 | $0 |
Source: Public Records
Map
Nearby Homes
- 8383 Dieter Dr
- Lafayette Plan at Villages of White Marsh - Townhomes
- Hampshire Plan at Villages of White Marsh
- Summit Plan at Villages of White Marsh
- Hadley Plan at Villages of White Marsh
- 41 Laurel Path Ct
- 5048 Silver Oak Dr
- 5046 Silver Oak Dr
- 5044 Silver Oak Dr
- 5085 Silver Oak Dr
- 5034 Silver Oak Dr
- 8 Comes Ridge Ct
- 8 Comes Ridge Ct
- 7 Comes Ridge Ct
- 6 Comes Ridge Ct
- 5 Comes Ridge Ct
- 4402 Cole Farm Rd
- 5 Comes Ridge Ct
- 4 Comes Ridge Ct
- 2 Comes Ridge Ct
- 5004 White Marsh Rd
- 5002 White Marsh Rd
- 5020 White Marsh Rd
- 5011 White Marsh Rd
- 4918 White Marsh Rd
- 5026 White Marsh Rd
- 8 Camrose Ct
- 9 Camrose Ct
- 8227 Selwin Ct
- 4912 White Marsh Rd
- 8225 Selwin Ct
- 6 Camrose Ct
- 5030 White Marsh Rd
- 7 Camrose Ct
- 8223 Selwin Ct
- 8221 Selwin Ct
- 4 Camrose Ct
- 5 Camrose Ct
- 5034 White Marsh Rd
- 8217 Selwin Ct