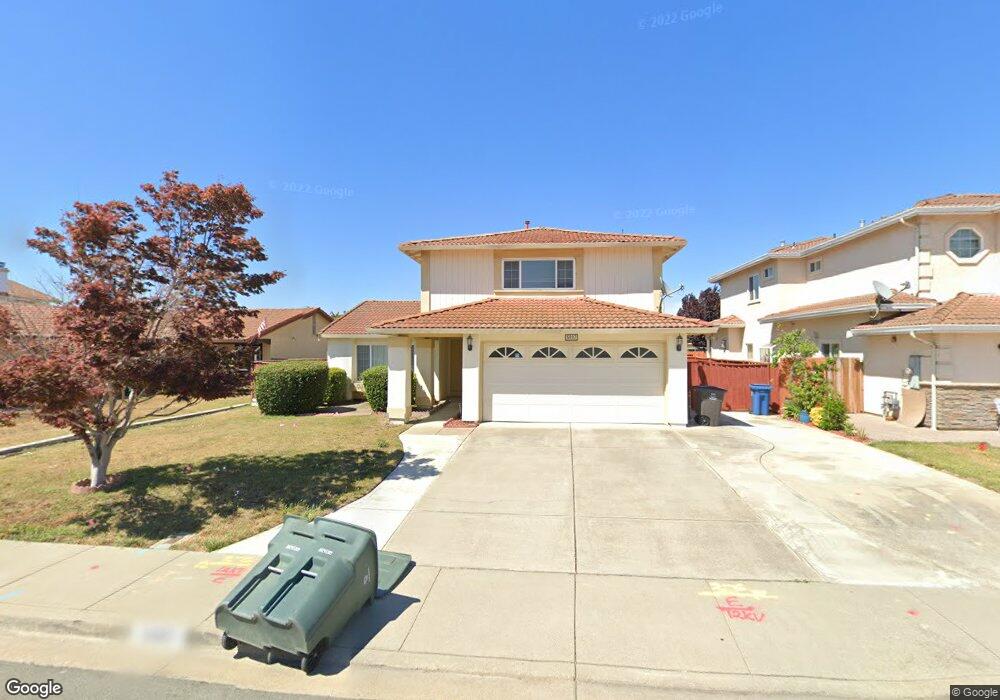
5007 Anaheim Loop Union City, CA 94587
Alvarado NeighborhoodEstimated Value: $1,399,000 - $1,634,000
4
Beds
3
Baths
1,871
Sq Ft
$805/Sq Ft
Est. Value
About This Home
This home is located at 5007 Anaheim Loop, Union City, CA 94587 and is currently estimated at $1,506,605, approximately $805 per square foot. 5007 Anaheim Loop is a home located in Alameda County with nearby schools including Pioneer Elementary School, Itliong-Vera Cruz, and James Logan High School.
Ownership History
Date
Name
Owned For
Owner Type
Purchase Details
Closed on
May 14, 2013
Sold by
Truong Kathy Hang and Dinh Ryan Anh
Bought by
Ip Kenny K C and Tsui Joanne W M
Current Estimated Value
Purchase Details
Closed on
Aug 13, 2003
Sold by
Singh Amarjit and Kaur Kulwinder
Bought by
Dinh Ryan Anh and Truong Kathy Hang
Home Financials for this Owner
Home Financials are based on the most recent Mortgage that was taken out on this home.
Original Mortgage
$448,000
Interest Rate
4.25%
Mortgage Type
Purchase Money Mortgage
Purchase Details
Closed on
Mar 3, 1999
Sold by
Bains Satnam S and Bains Jasbir K
Bought by
Singh Amarjit and Kaur Kulwinder
Home Financials for this Owner
Home Financials are based on the most recent Mortgage that was taken out on this home.
Original Mortgage
$240,000
Interest Rate
6.76%
Create a Home Valuation Report for This Property
The Home Valuation Report is an in-depth analysis detailing your home's value as well as a comparison with similar homes in the area
Home Values in the Area
Average Home Value in this Area
Purchase History
| Date | Buyer | Sale Price | Title Company |
|---|---|---|---|
| Ip Kenny K C | $650,000 | Chicago Title Company | |
| Dinh Ryan Anh | $560,000 | Placer Title Company | |
| Singh Amarjit | $315,000 | Fidelity National Title |
Source: Public Records
Mortgage History
| Date | Status | Borrower | Loan Amount |
|---|---|---|---|
| Previous Owner | Dinh Ryan Anh | $448,000 | |
| Previous Owner | Singh Amarjit | $240,000 | |
| Closed | Dinh Ryan Anh | $84,000 |
Source: Public Records
Tax History
| Year | Tax Paid | Tax Assessment Tax Assessment Total Assessment is a certain percentage of the fair market value that is determined by local assessors to be the total taxable value of land and additions on the property. | Land | Improvement |
|---|---|---|---|---|
| 2025 | $11,221 | $800,396 | $240,119 | $560,277 |
| 2024 | $11,221 | $784,705 | $235,411 | $549,294 |
| 2023 | $10,860 | $769,320 | $230,796 | $538,524 |
| 2022 | $10,714 | $754,240 | $226,272 | $527,968 |
| 2021 | $10,436 | $739,452 | $221,835 | $517,617 |
| 2020 | $10,413 | $731,873 | $219,562 | $512,311 |
| 2019 | $10,349 | $717,527 | $215,258 | $502,269 |
| 2018 | $10,102 | $703,461 | $211,038 | $492,423 |
| 2017 | $9,893 | $689,668 | $206,900 | $482,768 |
| 2016 | $9,675 | $676,148 | $202,844 | $473,304 |
| 2015 | $9,564 | $665,995 | $199,798 | $466,197 |
| 2014 | $9,168 | $652,950 | $195,885 | $457,065 |
Source: Public Records
Map
Nearby Homes
- 4822 La Habra St
- 32518 Shiela Ct
- 4819 Kenwood St
- 4701 Michelle Way
- 4648 Michelle Ct
- 4600 Delores Dr
- 33038 Garfinkle St
- 4940 Bunkhouse St
- 32409 Elizabeth Way
- 4625 Ruth Way
- 4469 Fellows St
- 32508 Regents Blvd
- 32301 Ruth Ct
- 5358 Matthew Terrace
- 5410 Buckner Terrace
- 34170 Via Torino
- 4311 Blondwood Ct
- 4513 Birchwood Ct
- 4541 Darcelle Dr
- 6031 Commerce Dr Unit 7
- 5005 Anaheim Loop
- 5009 Anaheim Loop
- 4972 Antioch Loop
- 4974 Antioch Loop
- 5003 Anaheim Loop
- 5011 Anaheim Loop
- 4970 Antioch Loop
- 4976 Antioch Loop
- 5008 Anaheim Loop
- 5010 Anaheim Loop
- 5006 Anaheim Loop
- 5013 Anaheim Loop
- 4968 Antioch Loop
- 5001 Anaheim Loop
- 5004 Anaheim Loop
- 5012 Anaheim Loop
- 4978 Antioch Loop
- 5002 Anaheim Loop
- 4966 Antioch Loop
- 5014 Anaheim Loop
Your Personal Tour Guide
Ask me questions while you tour the home.