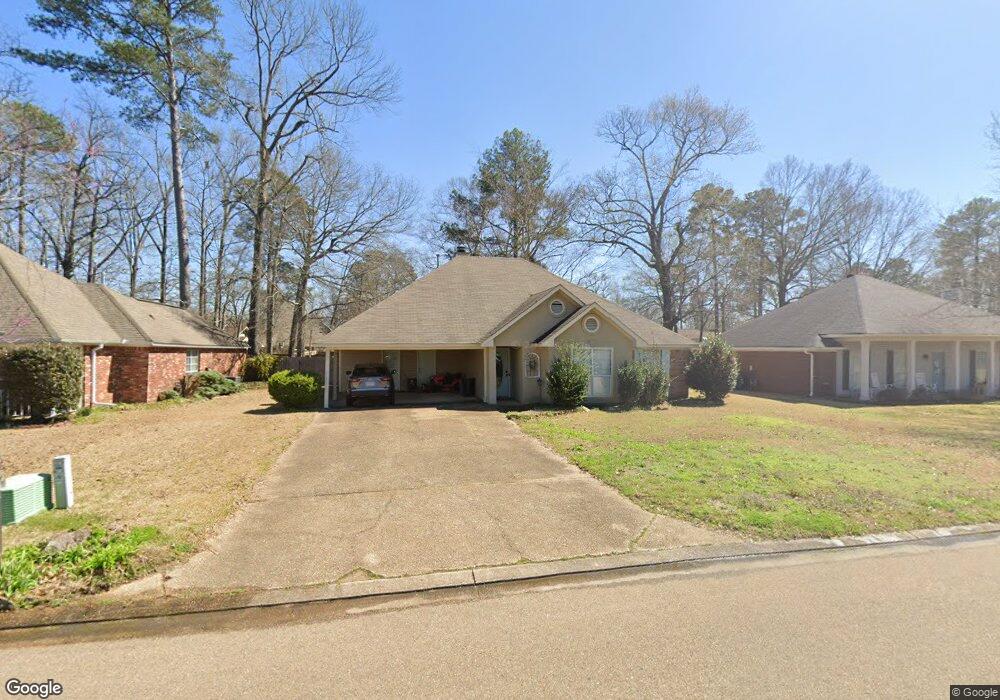
5007 Bay Bridge Flowood, MS 39232
Estimated Value: $248,645 - $258,000
3
Beds
2
Baths
1,398
Sq Ft
$180/Sq Ft
Est. Value
About This Home
This home is located at 5007 Bay Bridge, Flowood, MS 39232 and is currently estimated at $252,161, approximately $180 per square foot. 5007 Bay Bridge is a home located in Rankin County with nearby schools including Flowood Elementary School, Northwest Rankin Middle School, and Northwest Rankin High School.
Ownership History
Date
Name
Owned For
Owner Type
Purchase Details
Closed on
Mar 25, 2020
Sold by
Henderson Delores
Bought by
Dukes Jenny
Current Estimated Value
Home Financials for this Owner
Home Financials are based on the most recent Mortgage that was taken out on this home.
Original Mortgage
$166,666
Outstanding Balance
$145,707
Interest Rate
3.4%
Mortgage Type
New Conventional
Estimated Equity
$106,454
Purchase Details
Closed on
Mar 18, 2016
Sold by
Benson Jeremy R
Bought by
Henderson Troy H and Henderson Delores
Purchase Details
Closed on
Jul 28, 2008
Sold by
Stringer Robert Anthony and Stringer Jennifer
Bought by
Benson Jeremy R
Home Financials for this Owner
Home Financials are based on the most recent Mortgage that was taken out on this home.
Original Mortgage
$131,575
Interest Rate
6.43%
Purchase Details
Closed on
Jan 11, 2008
Sold by
Robert Anthony Robert Anthony
Bought by
Stringer Robert Anthony and Stringer Jennifer
Create a Home Valuation Report for This Property
The Home Valuation Report is an in-depth analysis detailing your home's value as well as a comparison with similar homes in the area
Home Values in the Area
Average Home Value in this Area
Purchase History
| Date | Buyer | Sale Price | Title Company |
|---|---|---|---|
| Dukes Jenny | -- | None Available | |
| Henderson Troy H | -- | Attorney | |
| Benson Jeremy R | -- | Title & Escrow Services, Inc | |
| Stringer Robert Anthony | -- | -- |
Source: Public Records
Mortgage History
| Date | Status | Borrower | Loan Amount |
|---|---|---|---|
| Open | Dukes Jenny | $166,666 | |
| Previous Owner | Benson Jeremy R | $131,575 |
Source: Public Records
Tax History
| Year | Tax Paid | Tax Assessment Tax Assessment Total Assessment is a certain percentage of the fair market value that is determined by local assessors to be the total taxable value of land and additions on the property. | Land | Improvement |
|---|---|---|---|---|
| 2025 | $1,238 | $12,886 | $0 | $0 |
| 2024 | $1,214 | $12,886 | $0 | $0 |
| 2023 | $1,134 | $12,203 | $0 | $0 |
| 2022 | $1,116 | $12,203 | $0 | $0 |
| 2021 | $1,116 | $12,203 | $0 | $0 |
| 2020 | $2,124 | $18,305 | $0 | $0 |
| 2019 | $1,972 | $16,602 | $0 | $0 |
| 2018 | $1,939 | $16,602 | $0 | $0 |
| 2017 | $1,939 | $16,602 | $0 | $0 |
| 2016 | $904 | $10,770 | $0 | $0 |
| 2015 | $904 | $10,770 | $0 | $0 |
| 2014 | $687 | $10,770 | $0 | $0 |
| 2013 | $687 | $10,770 | $0 | $0 |
Source: Public Records
Map
Nearby Homes
- 1210 Michael St
- 10 Estates Dr
- 608 Summer Place
- No Old Fannin Rd
- 3018 Windwood Cir
- 623 Summer Place
- 417 Westport Way
- 311 Longleaf Dr
- 407 Pelican Way
- 125 Pinevale St
- 4021 Brookwood Dr
- 430 Hemlock Dr
- 739 Whippoorwill Dr
- 610 Independence Blvd
- 146 Tradition Pkwy
- 0 Liberty Rd Unit 4118646
- 332 Swan Dr
- 326 Lasalle Ct
- 122 Belle Meade Blvd
- 188 Webb Ln
- 5007 Bay Bridge Dr
- 5009 Bay Bridge
- 5010 Bay Bridge
- 5010 Bay Bridge Dr
- 4025 Bay Bridge
- 232 Williams Cir
- 234 Williams Cir
- 236 Williams Cir
- 4021 Bay Bridge
- 4021 Bay Bridge
- 6010 Maplewood
- 501 Laurelwood Dr
- 230 Williams Cir
- 4024 Bay Bridge Dr
- 503 Laurelwood Dr
- 4021 Bay Bridge Dr
- 238 Williams Cir
- 18 Estates Dr
- 4024 Bay Bridge
- 6016 Maplewood
Your Personal Tour Guide
Ask me questions while you tour the home.