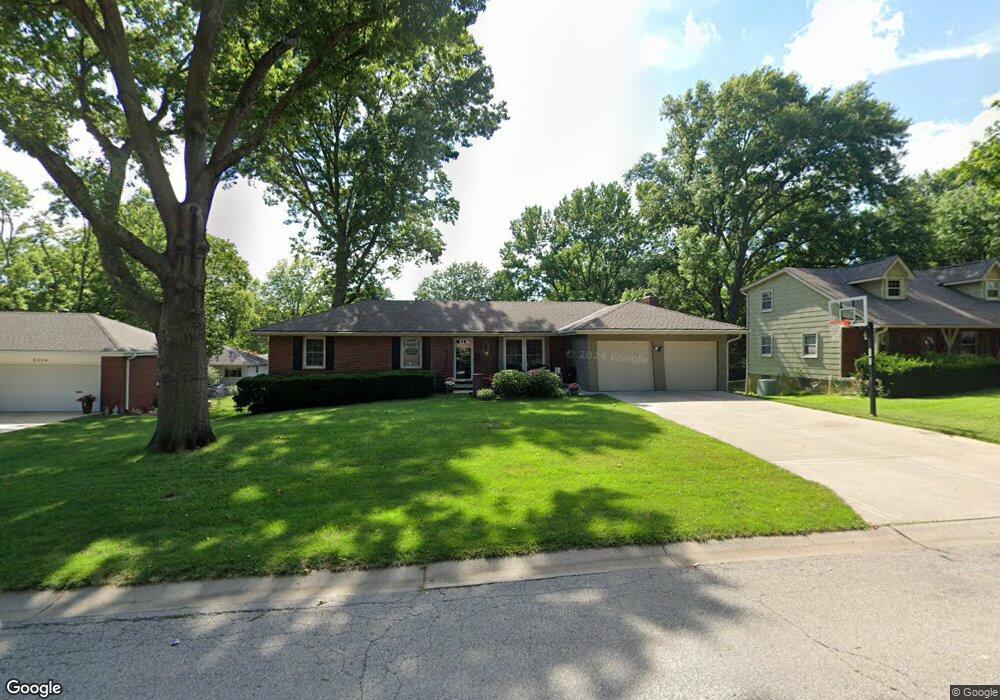
5008 Cody St Shawnee, KS 66203
Estimated Value: $325,000 - $336,000
3
Beds
2
Baths
1,278
Sq Ft
$258/Sq Ft
Est. Value
About This Home
This home is located at 5008 Cody St, Shawnee, KS 66203 and is currently estimated at $329,601, approximately $257 per square foot. 5008 Cody St is a home located in Johnson County with nearby schools including Bluejacket / Flint Elementary, Hocker Grove Middle School, and Shawnee Mission North High School.
Ownership History
Date
Name
Owned For
Owner Type
Purchase Details
Closed on
Apr 20, 2015
Sold by
Linn Scott R and Linn Jill B
Bought by
Gunter Edward L and Gunter Karen S
Current Estimated Value
Home Financials for this Owner
Home Financials are based on the most recent Mortgage that was taken out on this home.
Original Mortgage
$3,138,850
Outstanding Balance
$2,415,466
Interest Rate
3.73%
Mortgage Type
New Conventional
Estimated Equity
-$2,085,865
Purchase Details
Closed on
Apr 2, 2014
Sold by
Linn Scott R and Linn Jill B
Bought by
Linn Scott R and Linn Jill B
Purchase Details
Closed on
Dec 12, 2002
Sold by
Schoenberger Paul H and Wood Mary A
Bought by
Linn Scott R and Linn Jill B
Home Financials for this Owner
Home Financials are based on the most recent Mortgage that was taken out on this home.
Original Mortgage
$128,400
Interest Rate
6.05%
Create a Home Valuation Report for This Property
The Home Valuation Report is an in-depth analysis detailing your home's value as well as a comparison with similar homes in the area
Home Values in the Area
Average Home Value in this Area
Purchase History
| Date | Buyer | Sale Price | Title Company |
|---|---|---|---|
| Gunter Edward L | -- | Platinum Title Llc | |
| Linn Scott R | -- | None Available | |
| Linn Scott R | -- | Security Land Title Company |
Source: Public Records
Mortgage History
| Date | Status | Borrower | Loan Amount |
|---|---|---|---|
| Open | Gunter Edward L | $3,138,850 | |
| Previous Owner | Linn Scott R | $128,400 |
Source: Public Records
Tax History Compared to Growth
Tax History
| Year | Tax Paid | Tax Assessment Tax Assessment Total Assessment is a certain percentage of the fair market value that is determined by local assessors to be the total taxable value of land and additions on the property. | Land | Improvement |
|---|---|---|---|---|
| 2024 | $3,506 | $33,292 | $6,770 | $26,522 |
| 2023 | $3,466 | $32,361 | $6,149 | $26,212 |
| 2022 | $3,022 | $28,129 | $5,590 | $22,539 |
| 2021 | $3,022 | $26,186 | $4,858 | $21,328 |
| 2020 | $2,862 | $24,587 | $4,410 | $20,177 |
| 2019 | $2,547 | $21,850 | $4,199 | $17,651 |
| 2018 | $2,525 | $21,574 | $4,199 | $17,375 |
| 2017 | $2,499 | $21,022 | $3,813 | $17,209 |
| 2016 | $2,437 | $20,240 | $3,813 | $16,427 |
| 2015 | $2,309 | $19,964 | $3,813 | $16,151 |
| 2013 | -- | $18,595 | $3,813 | $14,782 |
Source: Public Records
Map
Nearby Homes
- 11403 W 51st Terrace
- 11907 W 49th Place
- 11815 W 53rd St
- 12023 W 48th St
- 13126 W 52nd Terrace
- 13134 W 52nd Terrace
- 13130 W 52nd Terrace
- 5308 Mcanany Dr
- 5407 Halsey St
- W 48th St
- 5504 Monrovia St
- 13305 W 51st St
- 14170 W 49th St
- 10511 W 49th Place
- 12508 W 56th St
- 11002 W 55th Terrace
- 5013 Bradshaw St
- 5021 Bradshaw St
- Ashwood Plan at Bristol Highlands - North
- The Fleetwood Plan at Bristol Highlands - The Villas