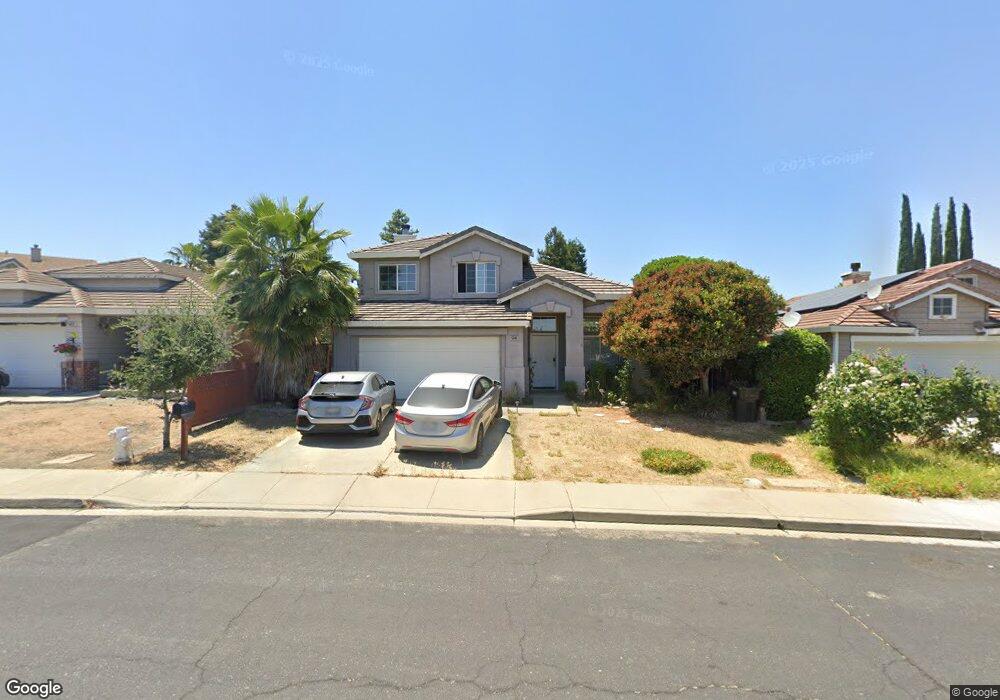
5008 Rockwall Way Antioch, CA 94531
Lone Tree Valley NeighborhoodEstimated Value: $556,000 - $591,000
3
Beds
3
Baths
1,473
Sq Ft
$391/Sq Ft
Est. Value
About This Home
This home is located at 5008 Rockwall Way, Antioch, CA 94531 and is currently estimated at $575,348, approximately $390 per square foot. 5008 Rockwall Way is a home located in Contra Costa County with nearby schools including Lone Tree Elementary School, Dallas Ranch Middle School, and Deer Valley High School.
Ownership History
Date
Name
Owned For
Owner Type
Purchase Details
Closed on
Apr 25, 2008
Sold by
U S Bank Na
Bought by
Gupta Som D and Gupta Lalita
Current Estimated Value
Home Financials for this Owner
Home Financials are based on the most recent Mortgage that was taken out on this home.
Original Mortgage
$202,480
Outstanding Balance
$128,162
Interest Rate
5.87%
Mortgage Type
Purchase Money Mortgage
Estimated Equity
$447,186
Purchase Details
Closed on
Mar 22, 2007
Sold by
Torres Lauren Bernice
Bought by
U S Bank Na
Purchase Details
Closed on
Jul 18, 2005
Sold by
Broussard Raymond J and Solorazano Enriqueta
Bought by
Torres Lauren Bernice
Home Financials for this Owner
Home Financials are based on the most recent Mortgage that was taken out on this home.
Original Mortgage
$409,600
Interest Rate
6%
Mortgage Type
Purchase Money Mortgage
Purchase Details
Closed on
Mar 17, 1997
Sold by
Kaufman & Broad Of N Calif
Bought by
Broussard Raymond J and Solorazano Enriqueta
Create a Home Valuation Report for This Property
The Home Valuation Report is an in-depth analysis detailing your home's value as well as a comparison with similar homes in the area
Home Values in the Area
Average Home Value in this Area
Purchase History
| Date | Buyer | Sale Price | Title Company |
|---|---|---|---|
| Gupta Som D | $253,500 | Fidelity National Title | |
| U S Bank Na | $433,023 | None Available | |
| Torres Lauren Bernice | $512,000 | Fidelity National Title | |
| Broussard Raymond J | $151,500 | First American Title Guarant |
Source: Public Records
Mortgage History
| Date | Status | Borrower | Loan Amount |
|---|---|---|---|
| Open | Gupta Som D | $202,480 | |
| Previous Owner | Torres Lauren Bernice | $409,600 |
Source: Public Records
Tax History Compared to Growth
Tax History
| Year | Tax Paid | Tax Assessment Tax Assessment Total Assessment is a certain percentage of the fair market value that is determined by local assessors to be the total taxable value of land and additions on the property. | Land | Improvement |
|---|---|---|---|---|
| 2025 | $4,057 | $332,304 | $131,343 | $200,961 |
| 2024 | $3,911 | $325,789 | $128,768 | $197,021 |
| 2023 | $3,911 | $319,402 | $126,244 | $193,158 |
| 2022 | $3,854 | $313,140 | $123,769 | $189,371 |
| 2021 | $3,739 | $307,001 | $121,343 | $185,658 |
| 2019 | $3,650 | $297,897 | $117,745 | $180,152 |
| 2018 | $3,514 | $292,057 | $115,437 | $176,620 |
| 2017 | $3,439 | $286,331 | $113,174 | $173,157 |
| 2016 | $3,352 | $280,717 | $110,955 | $169,762 |
| 2015 | $3,519 | $276,502 | $109,289 | $167,213 |
| 2014 | $3,886 | $271,087 | $107,149 | $163,938 |
Source: Public Records
Map
Nearby Homes
- 1157 Rockspring Way
- 4959 Star Mine Ct
- 1525 Barkley Mountain Way
- 5023 Vesteny Ct
- 5004 Star Mine Way
- 4925 Cache Peak Dr
- 4836 Belford Peak Way
- 5243 Delta View Way
- 5106 Watkings Way
- 1879 Mount Conness Way
- 4737 Crestone Peak Ct
- 1333 Mokelumne Dr
- 1928 Badger Pass Way
- 4688 Matterhorn Way
- 5065 Carbondale Way
- 5152 Cutler Ct
- 2133 Bamboo Way
- 5448 Southwood Way
- 1256 Mokelumne Ct
- 5488 Southwood Ct
- 5004 Rockwall Way
- 5012 Rockwall Way
- 1166 Rockspring Way
- 5000 Rockwall Way
- 5016 Rockwall Way
- 5004 Ranch Hollow Way
- 1158 Rockspring Way
- 5009 Rockwall Way
- 5000 Ranch Hollow Way
- 5005 Rockwall Way
- 5008 Ranch Hollow Way
- 5020 Rockwall Way
- 1154 Rockspring Way
- 5001 Rockwall Way
- 5012 Ranch Hollow Way
- 5016 Ranch Hollow Way
- 1173 Rockspring Way
- 1150 Rockspring Way
- 1165 Rockspring Way