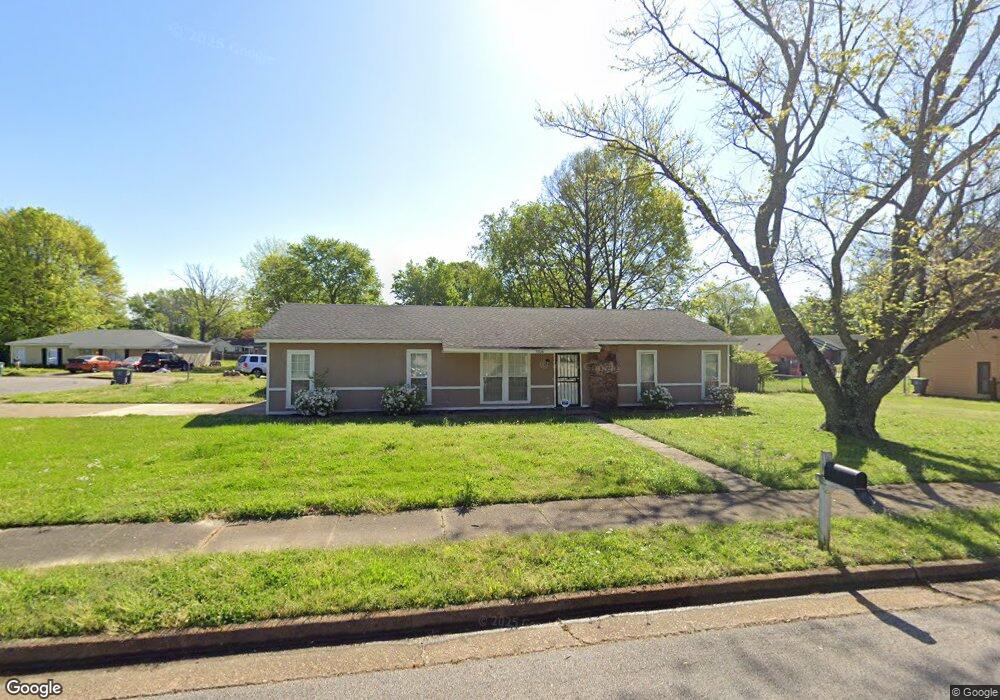
5008 Tradewind Terrace Memphis, TN 38118
Oakhaven NeighborhoodEstimated Value: $131,000 - $171,767
3
Beds
2
Baths
1,118
Sq Ft
$142/Sq Ft
Est. Value
About This Home
This home is located at 5008 Tradewind Terrace, Memphis, TN 38118 and is currently estimated at $158,942, approximately $142 per square foot. 5008 Tradewind Terrace is a home located in Shelby County with nearby schools including Ross Elementary School, Oakhaven Middle School, and Oakhaven High School.
Ownership History
Date
Name
Owned For
Owner Type
Purchase Details
Closed on
Feb 16, 2023
Sold by
Rei Nation Llc
Bought by
St Clair Crystal
Current Estimated Value
Home Financials for this Owner
Home Financials are based on the most recent Mortgage that was taken out on this home.
Original Mortgage
$112,500
Outstanding Balance
$108,970
Interest Rate
6.33%
Mortgage Type
New Conventional
Estimated Equity
$49,972
Purchase Details
Closed on
Aug 5, 2022
Sold by
U-Invest Captial Llc
Bought by
Rei Nation Llc
Purchase Details
Closed on
May 11, 2015
Sold by
Memphis Invest Gp
Bought by
U Invest Campital Llc
Purchase Details
Closed on
Apr 9, 2015
Sold by
Mdm Investmetns Of Memphis Llc
Bought by
Memphis Invest Gp
Purchase Details
Closed on
Jan 7, 2015
Sold by
Maxwell Peggy A
Bought by
Mdm Investments Of Memphis Llc
Create a Home Valuation Report for This Property
The Home Valuation Report is an in-depth analysis detailing your home's value as well as a comparison with similar homes in the area
Home Values in the Area
Average Home Value in this Area
Purchase History
| Date | Buyer | Sale Price | Title Company |
|---|---|---|---|
| St Clair Crystal | $150,000 | -- | |
| Rei Nation Llc | $99,000 | None Listed On Document | |
| U Invest Campital Llc | $82,900 | Fntg | |
| Memphis Invest Gp | $38,000 | Baymark Title & Escrow | |
| Mdm Investments Of Memphis Llc | -- | Baymark Title & Escrow Svcs |
Source: Public Records
Mortgage History
| Date | Status | Borrower | Loan Amount |
|---|---|---|---|
| Open | St Clair Crystal | $112,500 |
Source: Public Records
Tax History Compared to Growth
Tax History
| Year | Tax Paid | Tax Assessment Tax Assessment Total Assessment is a certain percentage of the fair market value that is determined by local assessors to be the total taxable value of land and additions on the property. | Land | Improvement |
|---|---|---|---|---|
| 2025 | $1,092 | $47,100 | $3,125 | $43,975 |
| 2024 | $1,092 | $32,200 | $2,500 | $29,700 |
| 2023 | $1,962 | $32,200 | $2,500 | $29,700 |
| 2022 | $1,453 | $23,850 | $2,500 | $21,350 |
| 2021 | $1,470 | $23,850 | $2,500 | $21,350 |
| 2020 | $1,283 | $17,700 | $2,500 | $15,200 |
| 2019 | $566 | $17,700 | $2,500 | $15,200 |
| 2018 | $566 | $17,700 | $2,500 | $15,200 |
| 2017 | $579 | $17,700 | $2,500 | $15,200 |
| 2016 | $586 | $13,400 | $0 | $0 |
| 2014 | $586 | $13,400 | $0 | $0 |
Source: Public Records
Map
Nearby Homes
- 5013 Holly Ridge Dr
- 3213 Applewood Cove
- 3190 Applewood Cove
- 3480 Cloudland Dr
- 3356 Burgess Dr
- 5082 Golden Oaks Dr
- 4752 Lofts Rd
- 4987 Scenicwood Cove
- 4759 Allrand Rd
- 3118 Argot Ave
- 3102 Comet Cove
- 3457 Meier Dr
- 2974 Larkwood Cove
- 5253 Zodiac Rd
- 5263 Zodiac Rd
- 5273 Zodiac Rd
- 5259 Zodiac Rd
- 5283 Zodiac Rd
- 5279 Zodiac Rd
- 4721 Queens Lace Ct Unit 56
- 3313 Tradewind Cove
- 5020 Tradewind Terrace
- 3320 Morningview Dr
- 5005 Tradewind Terrace
- 5011 Tradewind Terrace
- 3328 Morningview Dr
- 3316 Tradewind Cove
- 4986 Tradewind Terrace
- 5019 Tradewind Terrace
- 3334 Morningview Dr
- 4991 Tradewind Terrace
- 3312 Tradewind Cove
- 3340 Morningview Dr
- 4985 Tradewind Terrace
- 4978 Tradewind Terrace
- 3303 Morningview Dr
- 3309 Morningview Dr
- 3355 Cloudland Dr
- 4979 Tradewind Terrace
- 3344 Morningview Dr