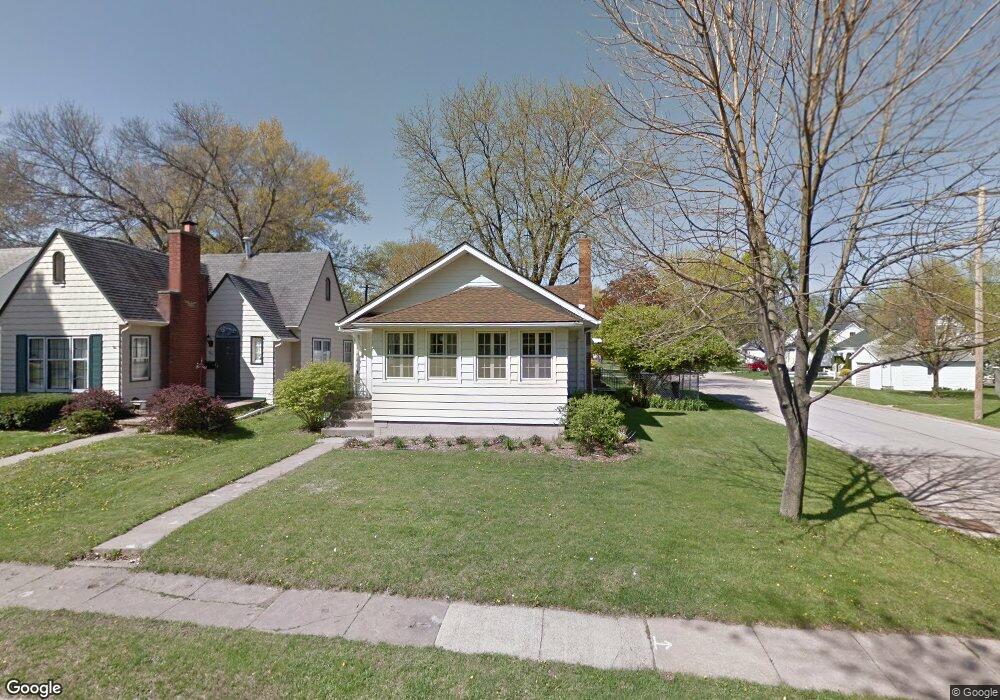
501 30th St SE Cedar Rapids, IA 52403
Bever Park NeighborhoodEstimated Value: $161,409 - $179,000
2
Beds
2
Baths
1,213
Sq Ft
$140/Sq Ft
Est. Value
About This Home
This home is located at 501 30th St SE, Cedar Rapids, IA 52403 and is currently estimated at $169,602, approximately $139 per square foot. 501 30th St SE is a home located in Linn County with nearby schools including Grant Wood Elementary School, Summit Elementary School, and McKinley STEAM Academy.
Ownership History
Date
Name
Owned For
Owner Type
Purchase Details
Closed on
Apr 5, 2013
Sold by
Martin Karen M and Martin Wayne D
Bought by
Martin Wayne D and Martin Karen M
Current Estimated Value
Home Financials for this Owner
Home Financials are based on the most recent Mortgage that was taken out on this home.
Original Mortgage
$105,370
Outstanding Balance
$74,343
Interest Rate
3.46%
Mortgage Type
FHA
Estimated Equity
$95,259
Purchase Details
Closed on
Mar 21, 2006
Sold by
Swanson James A
Bought by
Mahannah Karen M
Home Financials for this Owner
Home Financials are based on the most recent Mortgage that was taken out on this home.
Original Mortgage
$82,720
Interest Rate
6.74%
Mortgage Type
Fannie Mae Freddie Mac
Purchase Details
Closed on
Mar 17, 2004
Sold by
Hayek Timothy J
Bought by
Swanson James A
Home Financials for this Owner
Home Financials are based on the most recent Mortgage that was taken out on this home.
Original Mortgage
$77,200
Interest Rate
5.78%
Mortgage Type
Unknown
Create a Home Valuation Report for This Property
The Home Valuation Report is an in-depth analysis detailing your home's value as well as a comparison with similar homes in the area
Home Values in the Area
Average Home Value in this Area
Purchase History
| Date | Buyer | Sale Price | Title Company |
|---|---|---|---|
| Martin Wayne D | -- | Security First Title | |
| Mahannah Karen M | $103,000 | None Available | |
| Swanson James A | $96,000 | -- |
Source: Public Records
Mortgage History
| Date | Status | Borrower | Loan Amount |
|---|---|---|---|
| Open | Martin Wayne D | $105,370 | |
| Closed | Mahannah Karen M | $82,720 | |
| Previous Owner | Swanson James A | $77,200 | |
| Closed | Swanson James A | $19,300 |
Source: Public Records
Tax History Compared to Growth
Tax History
| Year | Tax Paid | Tax Assessment Tax Assessment Total Assessment is a certain percentage of the fair market value that is determined by local assessors to be the total taxable value of land and additions on the property. | Land | Improvement |
|---|---|---|---|---|
| 2025 | $2,210 | $139,400 | $25,400 | $114,000 |
| 2024 | $147 | $130,900 | $23,300 | $107,600 |
| 2023 | $147 | $124,900 | $22,200 | $102,700 |
| 2022 | $155 | $116,700 | $22,200 | $94,500 |
| 2021 | $2,376 | $108,600 | $20,100 | $88,500 |
| 2020 | $207 | $107,700 | $16,900 | $90,800 |
| 2019 | $2,236 | $103,700 | $16,900 | $86,800 |
| 2018 | $2,174 | $103,700 | $16,900 | $86,800 |
| 2017 | $2,068 | $97,300 | $16,900 | $80,400 |
| 2016 | $2,068 | $97,300 | $16,900 | $80,400 |
| 2015 | $2,120 | $99,642 | $16,933 | $82,709 |
| 2014 | $2,120 | $102,135 | $21,167 | $80,968 |
| 2013 | $2,126 | $102,135 | $21,167 | $80,968 |
Source: Public Records
Map
Nearby Homes
- 431 30th St SE
- 3200 Mound Ave SE
- 639 32nd St SE
- 3223 Mound Ave SE
- 415 35th St SE
- 700 Memorial Dr SE
- 637 Grant Wood Dr SE
- 651 34th St SE
- 2700 Mount Vernon Rd SE
- 654 26th St SE
- 654 34th St SE
- 705 Grant Wood Dr SE
- 18 Blake Terrace SE
- 435 Forest Dr SE
- 505 Forest Dr SE
- 2600 Mount Vernon Rd SE
- 1117 Crestview Dr SE
- 2323 Upland Dr SE
- 380 Indiandale Rd SE
- 2251 Bever Ave SE
- 505 30th St SE
- 511 30th St SE
- 433 30th St SE
- 2927 Mansfield Ave SE
- 515 30th St SE
- 519 30th St SE
- 2928 Mansfield Ave SE
- 2921 Mansfield Ave SE
- 500 30th St SE
- 508 30th St SE
- 2922 Mansfield Ave SE
- 427 30th St SE
- 428 30th St SE
- 2915 Mansfield Ave SE
- 525 30th St SE
- 516 30th St SE
- 424 30th St SE
- 520 30th St SE
- 2916 Mansfield Ave SE
- 420 30th St SE