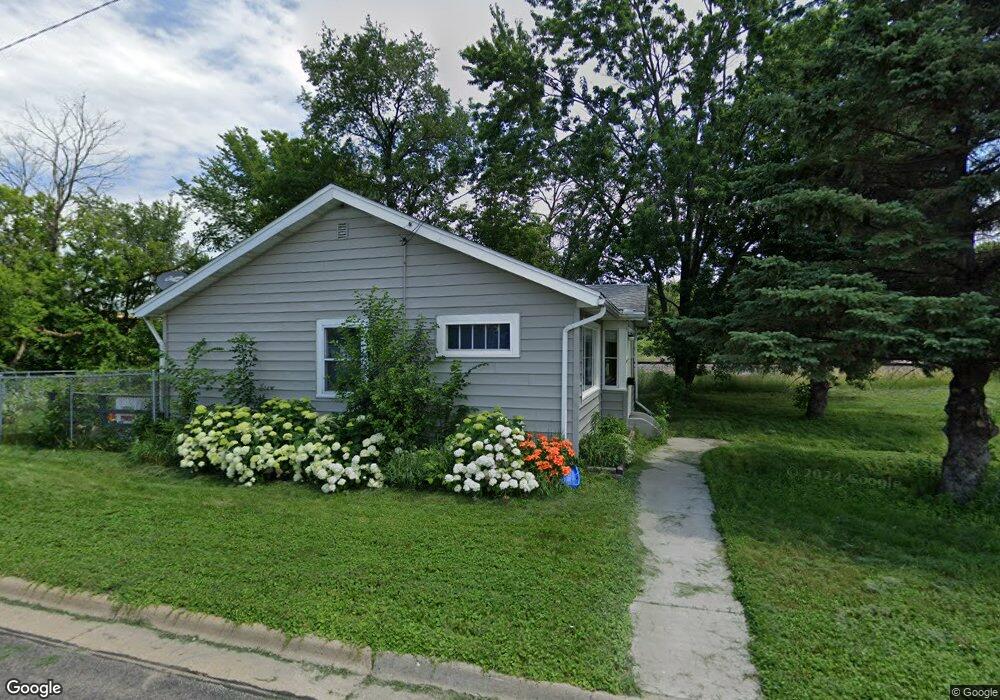
501 501 Broadway Ave St. Paul Park, MN 55071
Estimated Value: $161,000 - $199,000
1
Bed
1
Bath
672
Sq Ft
$273/Sq Ft
Est. Value
About This Home
This home is located at 501 501 Broadway Ave, St. Paul Park, MN 55071 and is currently estimated at $183,201, approximately $272 per square foot. 501 501 Broadway Ave is a home located in Washington County with nearby schools including Pullman Elementary School, Oltman Middle School, and Park Senior High School.
Ownership History
Date
Name
Owned For
Owner Type
Purchase Details
Closed on
Oct 13, 2021
Sold by
Sanz Heidi and Sanz Kenneth
Bought by
Gibbons Shawn
Current Estimated Value
Home Financials for this Owner
Home Financials are based on the most recent Mortgage that was taken out on this home.
Original Mortgage
$157,003
Outstanding Balance
$143,172
Interest Rate
2.8%
Mortgage Type
FHA
Estimated Equity
$40,029
Purchase Details
Closed on
Jan 15, 2020
Sold by
Johnson Joseph A
Bought by
Sanz Kenneth and Sanz Heidi
Home Financials for this Owner
Home Financials are based on the most recent Mortgage that was taken out on this home.
Original Mortgage
$61,458
Interest Rate
3.87%
Mortgage Type
FHA
Purchase Details
Closed on
Jun 10, 2015
Sold by
Citifinancial Services Inc
Bought by
Johnson Joseph A
Purchase Details
Closed on
Oct 13, 2014
Sold by
Posterick Cynthia L
Bought by
Citifinancial Services Inc
Create a Home Valuation Report for This Property
The Home Valuation Report is an in-depth analysis detailing your home's value as well as a comparison with similar homes in the area
Home Values in the Area
Average Home Value in this Area
Purchase History
| Date | Buyer | Sale Price | Title Company |
|---|---|---|---|
| Gibbons Shawn | $159,900 | Trademark Title Services | |
| Sanz Kenneth | $92,500 | Executive Title Services | |
| Johnson Joseph A | $46,151 | Freibert & Mattingly Title G | |
| Citifinancial Services Inc | $59,565 | None Available |
Source: Public Records
Mortgage History
| Date | Status | Borrower | Loan Amount |
|---|---|---|---|
| Open | Gibbons Shawn | $157,003 | |
| Previous Owner | Sanz Kenneth | $61,458 |
Source: Public Records
Tax History Compared to Growth
Tax History
| Year | Tax Paid | Tax Assessment Tax Assessment Total Assessment is a certain percentage of the fair market value that is determined by local assessors to be the total taxable value of land and additions on the property. | Land | Improvement |
|---|---|---|---|---|
| 2024 | $1,720 | $140,000 | $51,000 | $89,000 |
| 2023 | $1,720 | $136,400 | $51,000 | $85,400 |
| 2022 | $1,160 | $121,000 | $40,800 | $80,200 |
| 2021 | $1,088 | $100,800 | $34,000 | $66,800 |
| 2020 | $1,064 | $97,400 | $34,000 | $63,400 |
| 2019 | $1,280 | $94,800 | $34,000 | $60,800 |
| 2018 | $1,538 | $104,200 | $40,000 | $64,200 |
| 2017 | $1,476 | $100,300 | $40,000 | $60,300 |
| 2016 | $1,482 | $98,100 | $38,000 | $60,100 |
| 2015 | $1,274 | $72,800 | $31,000 | $41,800 |
| 2013 | -- | $60,000 | $26,500 | $33,500 |
Source: Public Records
Map
Nearby Homes
- TBD Broadway Ave
- 801 Summit Ave
- 11XX 1st St
- 1033 Portland Ave
- 6444 Genevieve Trail
- 1142 1st St
- 6538 Genevieve Trail
- 1200 Summit Ave
- 6219 64th St S
- 6266 Highland Hills Ln S
- 6283 Highland Hills Ln S
- 6278 Highland Hills Ln S
- 6291 Highland Hills Ln S
- 6284 Highland Hills Ln S
- 6295 Highland Hills Ln S
- 6290 Highland Hills Ln S
- Mercer Plan at Hawthorne - Expressions
- Newberry Plan at Hawthorne - Expressions
- Crisfield Plan at Hawthorne - Inspiration
- Aspire Plan at Hawthorne - Inspiration
- 501 Broadway Ave
- 445 Broadway Ave
- xxx Broadway Ave
- XXXX Lot A Blk 256
- xxx Lot A Blk 256
- xxxx Blk A B 213-219 232-263 Lot 12
- 610 4th St
- 524 Broadway Ave
- 618 4th St
- 335 Broadway Ave
- 622 4th St
- 321 Broadway Ave
- 0 Unassigned Address Unit 3666978
- 528 Broadway Ave
- 545 Broadway Ave
- 544 Broadway Ave
- 623 4th St
- 636 4th St
- 615 Pleasant Ave
- 627 4th St