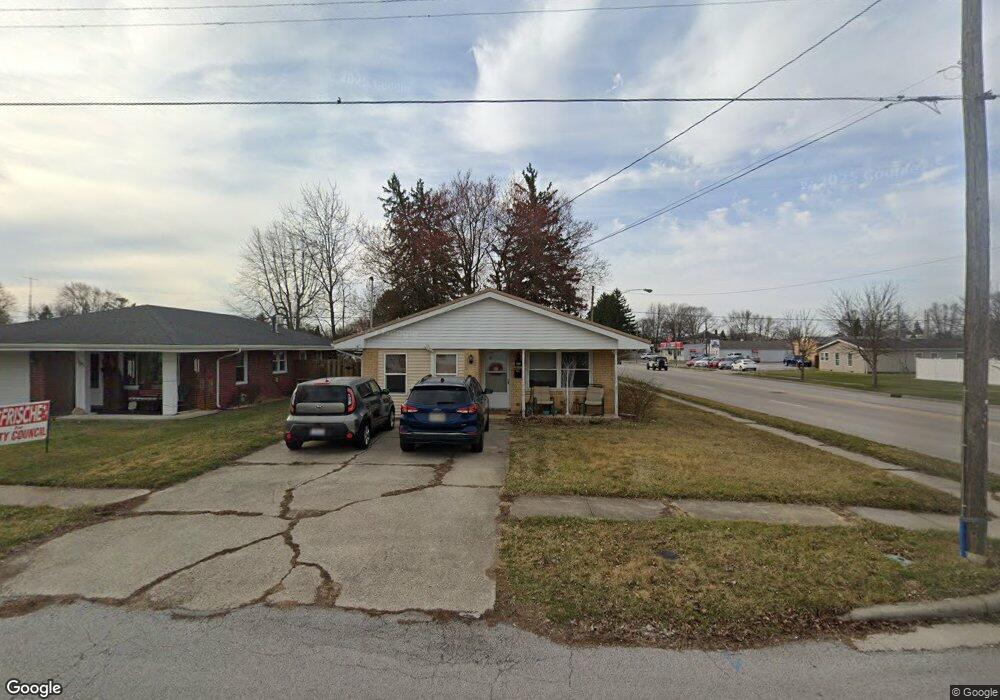
501 Allen Ave Findlay, OH 45840
Estimated Value: $155,000 - $182,000
3
Beds
1
Bath
1,236
Sq Ft
$136/Sq Ft
Est. Value
About This Home
This home is located at 501 Allen Ave, Findlay, OH 45840 and is currently estimated at $167,968, approximately $135 per square foot. 501 Allen Ave is a home located in Hancock County with nearby schools including Whittier Primary School, Bigelow Hill Elementary School, and Glenwood Middle School.
Ownership History
Date
Name
Owned For
Owner Type
Purchase Details
Closed on
Jun 9, 2004
Sold by
Waller Theresa L
Bought by
Walker Sandra J
Current Estimated Value
Home Financials for this Owner
Home Financials are based on the most recent Mortgage that was taken out on this home.
Original Mortgage
$80,733
Outstanding Balance
$39,624
Interest Rate
6.06%
Mortgage Type
FHA
Estimated Equity
$128,344
Purchase Details
Closed on
Jul 6, 2001
Sold by
Reuter Mary K
Bought by
Waller Theresa L
Home Financials for this Owner
Home Financials are based on the most recent Mortgage that was taken out on this home.
Original Mortgage
$74,312
Interest Rate
7.2%
Mortgage Type
FHA
Purchase Details
Closed on
Aug 6, 1990
Bought by
Calhoun Esther F
Purchase Details
Closed on
Dec 28, 1987
Bought by
Sanders Eleanor J
Purchase Details
Closed on
Oct 30, 1987
Bought by
Williamson Myrtle M
Purchase Details
Closed on
Jun 19, 1986
Bought by
Williamson James R
Purchase Details
Closed on
Jun 12, 1984
Bought by
Williamson James R
Create a Home Valuation Report for This Property
The Home Valuation Report is an in-depth analysis detailing your home's value as well as a comparison with similar homes in the area
Home Values in the Area
Average Home Value in this Area
Purchase History
| Date | Buyer | Sale Price | Title Company |
|---|---|---|---|
| Walker Sandra J | $82,000 | Mid Am Title | |
| Waller Theresa L | $74,900 | -- | |
| Calhoun Esther F | $58,000 | -- | |
| Sanders Eleanor J | $49,000 | -- | |
| Williamson Myrtle M | -- | -- | |
| Williamson James R | -- | -- | |
| Williamson James R | $42,900 | -- |
Source: Public Records
Mortgage History
| Date | Status | Borrower | Loan Amount |
|---|---|---|---|
| Open | Walker Sandra J | $80,733 | |
| Previous Owner | Waller Theresa L | $74,312 |
Source: Public Records
Tax History Compared to Growth
Tax History
| Year | Tax Paid | Tax Assessment Tax Assessment Total Assessment is a certain percentage of the fair market value that is determined by local assessors to be the total taxable value of land and additions on the property. | Land | Improvement |
|---|---|---|---|---|
| 2024 | $1,390 | $39,130 | $3,970 | $35,160 |
| 2023 | $1,392 | $39,130 | $3,970 | $35,160 |
| 2022 | $1,387 | $39,130 | $3,970 | $35,160 |
| 2021 | $1,273 | $31,270 | $3,990 | $27,280 |
| 2020 | $1,273 | $31,270 | $3,990 | $27,280 |
| 2019 | $1,247 | $31,270 | $3,990 | $27,280 |
| 2018 | $1,106 | $25,450 | $3,620 | $21,830 |
| 2017 | $1,107 | $25,450 | $3,620 | $21,830 |
| 2016 | $1,100 | $25,450 | $3,620 | $21,830 |
| 2015 | $1,005 | $22,980 | $3,960 | $19,020 |
| 2014 | $1,005 | $22,980 | $3,960 | $19,020 |
| 2012 | $1,013 | $22,980 | $3,960 | $19,020 |
Source: Public Records
Map
Nearby Homes
- 420 Allen Ave
- 334 E Foulke Ave
- 715 Christina Ct
- 230 Midland Ave
- 1010 Brenda Ct
- 206 Midland Ave
- 716 Winfield Ave
- 1062 Vincent St
- 247 Crystal Ave
- 115 George St
- 1908 Gayle Ln
- 600 Charles Ave
- 1825 Pershing St
- 0 Sheridan Ave
- 207 Ash Ave
- 1216 Concord Ct
- 1820 N Main St
- 2100 Candlewick Dr
- 1736 Woodridge Crescent
- 0 E Melrose Ave