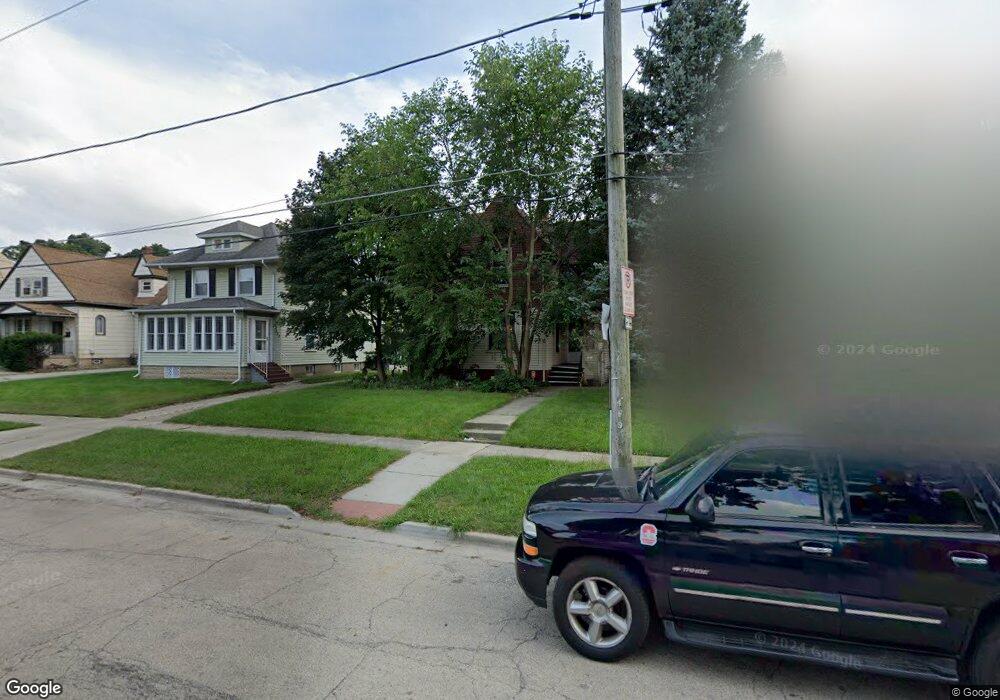
501 Barrett St Elgin, IL 60120
Gifford Park NeighborhoodEstimated Value: $246,000 - $285,000
3
Beds
1
Bath
1,424
Sq Ft
$183/Sq Ft
Est. Value
About This Home
This home is located at 501 Barrett St, Elgin, IL 60120 and is currently estimated at $260,160, approximately $182 per square foot. 501 Barrett St is a home located in Kane County with nearby schools including Channing Memorial Elementary School, Ellis Middle School, and Elgin High School.
Ownership History
Date
Name
Owned For
Owner Type
Purchase Details
Closed on
Jan 29, 2001
Sold by
Daniels Gwendolyn and Dennis Gwendolyn
Bought by
Weninger Jason A and Weninger Dawn
Current Estimated Value
Home Financials for this Owner
Home Financials are based on the most recent Mortgage that was taken out on this home.
Original Mortgage
$117,638
Outstanding Balance
$42,556
Interest Rate
7.1%
Mortgage Type
FHA
Estimated Equity
$217,604
Purchase Details
Closed on
Dec 15, 1997
Sold by
St Johns Evangelical Lutheran Church
Bought by
Daniels Gwendolyn
Home Financials for this Owner
Home Financials are based on the most recent Mortgage that was taken out on this home.
Original Mortgage
$96,012
Interest Rate
7.26%
Mortgage Type
FHA
Purchase Details
Closed on
May 8, 1997
Sold by
Morton Myra Jane and Kuznik Reverend Rollin
Bought by
St Johns Evangelical Lutheran Church
Create a Home Valuation Report for This Property
The Home Valuation Report is an in-depth analysis detailing your home's value as well as a comparison with similar homes in the area
Home Values in the Area
Average Home Value in this Area
Purchase History
| Date | Buyer | Sale Price | Title Company |
|---|---|---|---|
| Weninger Jason A | $119,500 | Ticor Title Insurance Compan | |
| Daniels Gwendolyn | -- | Chicago Title Insurance Co | |
| St Johns Evangelical Lutheran Church | -- | -- |
Source: Public Records
Mortgage History
| Date | Status | Borrower | Loan Amount |
|---|---|---|---|
| Open | Weninger Jason A | $117,638 | |
| Previous Owner | Daniels Gwendolyn | $96,012 |
Source: Public Records
Tax History
| Year | Tax Paid | Tax Assessment Tax Assessment Total Assessment is a certain percentage of the fair market value that is determined by local assessors to be the total taxable value of land and additions on the property. | Land | Improvement |
|---|---|---|---|---|
| 2024 | $5,196 | $64,923 | $13,630 | $51,293 |
| 2023 | $5,000 | $58,653 | $12,314 | $46,339 |
| 2022 | $4,637 | $53,481 | $11,228 | $42,253 |
| 2021 | $4,461 | $50,001 | $10,497 | $39,504 |
| 2020 | $4,190 | $45,938 | $10,021 | $35,917 |
| 2019 | $4,087 | $43,759 | $9,546 | $34,213 |
| 2018 | $3,886 | $39,304 | $8,993 | $30,311 |
| 2017 | $3,822 | $37,157 | $8,502 | $28,655 |
| 2016 | $3,676 | $34,472 | $7,888 | $26,584 |
| 2015 | -- | $31,597 | $7,230 | $24,367 |
| 2014 | -- | $31,207 | $7,141 | $24,066 |
| 2013 | -- | $36,389 | $7,329 | $29,060 |
Source: Public Records
Map
Nearby Homes
- 483 Barrett St
- 450 Villa St
- 332-334 St Charles St
- 277 Gifford Place
- 262 Bartlett Place
- 457 Arlington Ave
- 631 Bent St
- 518 Raymond St
- 115 N Porter St
- 689 Bent St
- 211 Prairie St
- 216 Prairie St
- 513 Cookane Ave
- 131 N Gifford St
- 7 National St Unit 7
- 3 National St Unit 3
- 453 Addison St
- 833 Forest Ave
- 445 Lucile Ave
- 268 N Gifford St
Your Personal Tour Guide
Ask me questions while you tour the home.