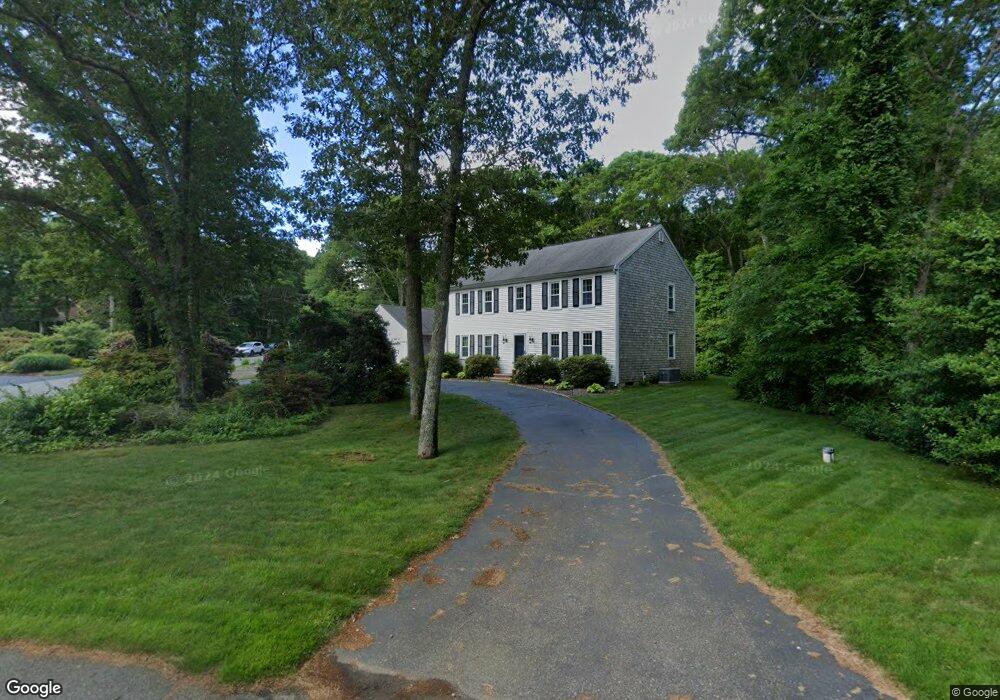
501 Cedar St West Barnstable, MA 02668
West Barnstable NeighborhoodEstimated Value: $879,606 - $1,105,000
4
Beds
3
Baths
2,592
Sq Ft
$377/Sq Ft
Est. Value
About This Home
This home is located at 501 Cedar St, West Barnstable, MA 02668 and is currently estimated at $975,902, approximately $376 per square foot. 501 Cedar St is a home located in Barnstable County with nearby schools including West Barnstable Elementary School, Barnstable United Elementary School, and Barnstable Intermediate School.
Ownership History
Date
Name
Owned For
Owner Type
Purchase Details
Closed on
Apr 30, 2004
Sold by
Dacosta Manuel and Dacosta Olivia L
Bought by
Barnocky Ian W
Current Estimated Value
Home Financials for this Owner
Home Financials are based on the most recent Mortgage that was taken out on this home.
Original Mortgage
$489,900
Outstanding Balance
$227,429
Interest Rate
5.36%
Mortgage Type
Purchase Money Mortgage
Estimated Equity
$748,473
Purchase Details
Closed on
Nov 12, 1992
Sold by
Frankenstein Marc C and Frankenstein Amy J
Bought by
Dacosta Manuel
Purchase Details
Closed on
May 30, 1991
Sold by
Dorfman David M and Dorfman Melody E
Bought by
Frankenstein Marc C
Home Financials for this Owner
Home Financials are based on the most recent Mortgage that was taken out on this home.
Original Mortgage
$150,000
Interest Rate
9.35%
Mortgage Type
Purchase Money Mortgage
Create a Home Valuation Report for This Property
The Home Valuation Report is an in-depth analysis detailing your home's value as well as a comparison with similar homes in the area
Home Values in the Area
Average Home Value in this Area
Purchase History
| Date | Buyer | Sale Price | Title Company |
|---|---|---|---|
| Barnocky Ian W | $545,000 | -- | |
| Dacosta Manuel | $195,900 | -- | |
| Frankenstein Marc C | $193,000 | -- |
Source: Public Records
Mortgage History
| Date | Status | Borrower | Loan Amount |
|---|---|---|---|
| Open | Barnocky Ian W | $489,900 | |
| Previous Owner | Frankenstein Marc C | $150,000 |
Source: Public Records
Tax History
| Year | Tax Paid | Tax Assessment Tax Assessment Total Assessment is a certain percentage of the fair market value that is determined by local assessors to be the total taxable value of land and additions on the property. | Land | Improvement |
|---|---|---|---|---|
| 2025 | $7,743 | $829,000 | $199,200 | $629,800 |
| 2024 | $6,747 | $786,400 | $199,200 | $587,200 |
| 2023 | $6,423 | $705,000 | $196,900 | $508,100 |
| 2022 | $6,186 | $556,800 | $140,000 | $416,800 |
| 2021 | $6,133 | $523,300 | $140,000 | $383,300 |
| 2020 | $5,759 | $475,200 | $140,000 | $335,200 |
| 2019 | $5,894 | $480,000 | $140,000 | $340,000 |
| 2018 | $5,450 | $439,900 | $153,500 | $286,400 |
| 2017 | $5,282 | $431,500 | $153,500 | $278,000 |
| 2016 | $5,135 | $428,300 | $150,300 | $278,000 |
| 2015 | $5,119 | $428,000 | $152,100 | $275,900 |
Source: Public Records
Map
Nearby Homes
- 510 Cedar St
- 26 Carlson Ln
- 6 Harpers Hollow
- 46 Service Rd
- 7 Maxwell Ln
- 159 Great Hill Rd
- 3 Mulberry Cir
- 282 Parker Rd
- 817 Race Ln
- 817 Race Ln
- 29 Fish House Rd
- 4 Wing Blvd
- 566 Route 6a
- 74 Saddler Ln
- 80 Branch Terrace
- 29 Appaloosa Way
- 6 George Gallant Rd
- 0 Captain Kidd Rd
- 82 Old Fields Rd
- 507 Route 6a Unit 9
Your Personal Tour Guide
Ask me questions while you tour the home.