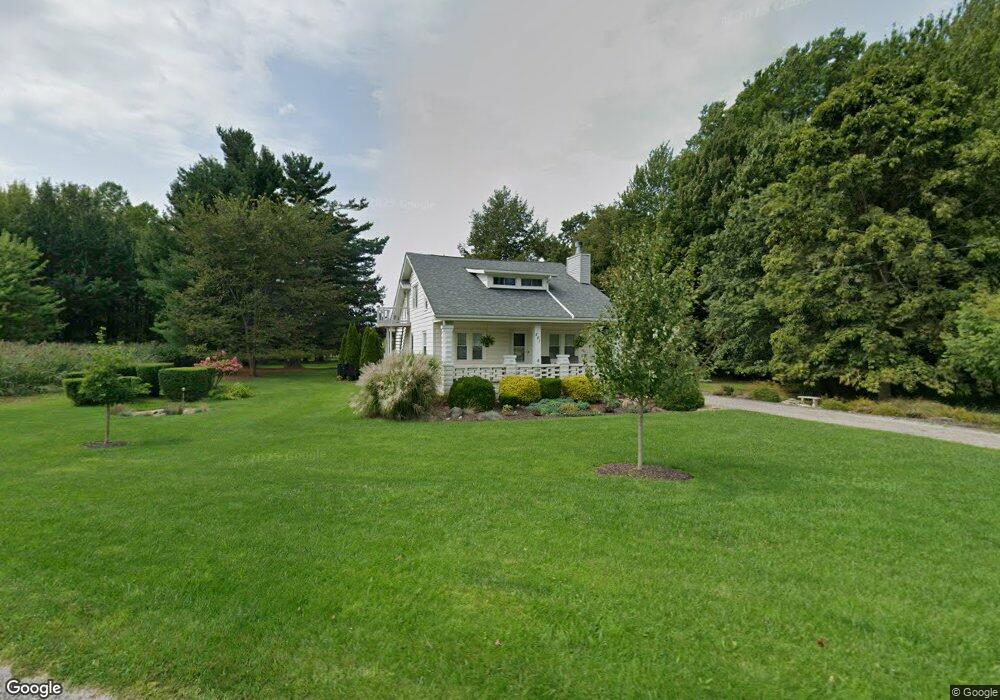
501 Dorman Rd Conneaut, OH 44030
Estimated Value: $223,871 - $340,000
4
Beds
2
Baths
1,806
Sq Ft
$154/Sq Ft
Est. Value
About This Home
This home is located at 501 Dorman Rd, Conneaut, OH 44030 and is currently estimated at $277,624, approximately $153 per square foot. 501 Dorman Rd is a home located in Ashtabula County with nearby schools including Lakeshore Primary Elementary School, Gateway Elementary School, and Conneaut Middle School.
Ownership History
Date
Name
Owned For
Owner Type
Purchase Details
Closed on
Nov 16, 2017
Sold by
Burkell Daniel J and Burkell Luda A
Bought by
Burkell Daniel J and Burkell Luda A
Current Estimated Value
Purchase Details
Closed on
Jan 25, 2014
Sold by
Burkell James J
Bought by
Burkell James J and Burkell Daniel J
Home Financials for this Owner
Home Financials are based on the most recent Mortgage that was taken out on this home.
Original Mortgage
$72,972
Interest Rate
4.55%
Mortgage Type
FHA
Create a Home Valuation Report for This Property
The Home Valuation Report is an in-depth analysis detailing your home's value as well as a comparison with similar homes in the area
Home Values in the Area
Average Home Value in this Area
Purchase History
| Date | Buyer | Sale Price | Title Company |
|---|---|---|---|
| Burkell Daniel J | -- | None Available | |
| Burkell James J | -- | None Available |
Source: Public Records
Mortgage History
| Date | Status | Borrower | Loan Amount |
|---|---|---|---|
| Closed | Burkell James J | $72,972 |
Source: Public Records
Tax History Compared to Growth
Tax History
| Year | Tax Paid | Tax Assessment Tax Assessment Total Assessment is a certain percentage of the fair market value that is determined by local assessors to be the total taxable value of land and additions on the property. | Land | Improvement |
|---|---|---|---|---|
| 2024 | $3,595 | $49,150 | $17,890 | $31,260 |
| 2023 | $2,291 | $49,150 | $17,890 | $31,260 |
| 2022 | $2,107 | $39,800 | $13,760 | $26,040 |
| 2021 | $2,143 | $39,800 | $13,760 | $26,040 |
| 2020 | $2,142 | $39,800 | $13,760 | $26,040 |
| 2019 | $2,243 | $40,990 | $9,240 | $31,750 |
| 2018 | $2,138 | $40,990 | $9,240 | $31,750 |
| 2017 | $2,029 | $40,990 | $9,240 | $31,750 |
| 2016 | $1,905 | $39,800 | $8,960 | $30,840 |
| 2015 | $1,924 | $39,800 | $8,960 | $30,840 |
| 2014 | $1,696 | $39,800 | $8,960 | $30,840 |
| 2013 | $1,677 | $40,330 | $17,190 | $23,140 |
Source: Public Records
Map
Nearby Homes
- 0 Dorman Rd
- 264 High St
- 251 St Rt 7
- 522 Furnace Rd
- 370 E Underridge Rd
- 455 Main St
- 18 Hillcrest Ct
- 284 Clay St
- 289 Harbor St
- 396 Bell St
- 146 Nickle Plate Ave
- 179 Marshall St
- 593 Furnace Rd
- 386 Washington St
- 402 Broad St
- 408 Broad State Rd 7 St
- 589 Main St
- 413 Harbor St
- 536 Madison St
- 179 Hayward Ave