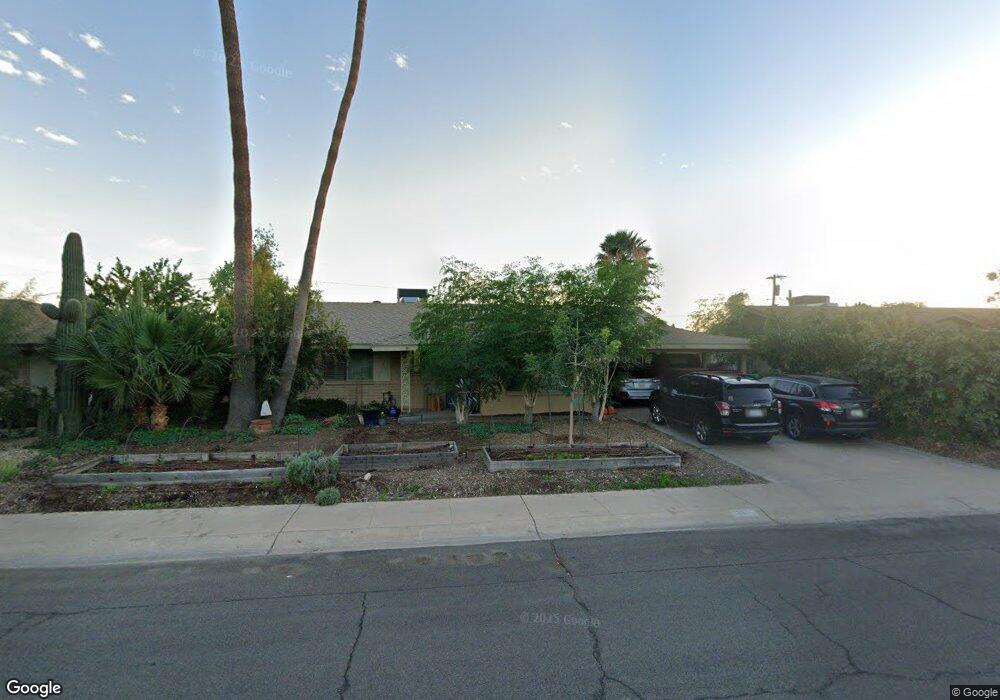
501 E Del Rio Dr Tempe, AZ 85282
Alameda NeighborhoodEstimated Value: $469,409 - $567,000
4
Beds
2
Baths
1,698
Sq Ft
$307/Sq Ft
Est. Value
About This Home
This home is located at 501 E Del Rio Dr, Tempe, AZ 85282 and is currently estimated at $521,602, approximately $307 per square foot. 501 E Del Rio Dr is a home located in Maricopa County with nearby schools including Broadmor Elementary School, Connolly Middle School, and Tempe High School.
Ownership History
Date
Name
Owned For
Owner Type
Purchase Details
Closed on
Jun 17, 2013
Sold by
Bolinger Barbara L and Gionet Sandra L
Bought by
Larson Brent and Larson Lyle
Current Estimated Value
Purchase Details
Closed on
Nov 16, 2011
Sold by
Bolinger Barbara L and Gionet Sandra L
Bought by
Bolinger Barbara L and Gionet Sandra L
Home Financials for this Owner
Home Financials are based on the most recent Mortgage that was taken out on this home.
Original Mortgage
$98,600
Interest Rate
4.06%
Mortgage Type
Purchase Money Mortgage
Purchase Details
Closed on
Mar 17, 2009
Sold by
Bolinger Virgilee C and Bolinger Barbara Lee
Bought by
Bolinger Bo and Bolinger Barbara L
Purchase Details
Closed on
Sep 14, 1995
Sold by
Gardner Gary H
Bought by
Gardner Richard D
Purchase Details
Closed on
Sep 13, 1995
Sold by
Gardner Edward S
Bought by
Gardner Richard D
Create a Home Valuation Report for This Property
The Home Valuation Report is an in-depth analysis detailing your home's value as well as a comparison with similar homes in the area
Home Values in the Area
Average Home Value in this Area
Purchase History
| Date | Buyer | Sale Price | Title Company |
|---|---|---|---|
| Larson Brent | $202,000 | Great American Title Agency | |
| Bolinger Barbara L | -- | None Available | |
| Bolinger Barbara L | -- | None Available | |
| Bolinger Bo | -- | None Available | |
| Gardner Richard D | -- | United Title Agency | |
| Gardner Richard D | -- | United Title Agency |
Source: Public Records
Mortgage History
| Date | Status | Borrower | Loan Amount |
|---|---|---|---|
| Previous Owner | Bolinger Barbara L | $98,600 |
Source: Public Records
Tax History
| Year | Tax Paid | Tax Assessment Tax Assessment Total Assessment is a certain percentage of the fair market value that is determined by local assessors to be the total taxable value of land and additions on the property. | Land | Improvement |
|---|---|---|---|---|
| 2025 | $2,242 | $21,504 | -- | -- |
| 2024 | $2,057 | $20,480 | -- | -- |
| 2023 | $2,057 | $42,520 | $8,500 | $34,020 |
| 2022 | $1,964 | $31,810 | $6,360 | $25,450 |
| 2021 | $2,003 | $29,170 | $5,830 | $23,340 |
| 2020 | $1,937 | $27,030 | $5,400 | $21,630 |
| 2019 | $1,899 | $25,460 | $5,090 | $20,370 |
| 2018 | $1,848 | $24,650 | $4,930 | $19,720 |
| 2017 | $1,791 | $23,410 | $4,680 | $18,730 |
| 2016 | $1,782 | $23,710 | $4,740 | $18,970 |
| 2015 | $1,724 | $18,770 | $3,750 | $15,020 |
Source: Public Records
Map
Nearby Homes
- 429 E Loyola Dr
- 22332 W Dnp Test Listing St E Unit 29
- 233 E Erie Dr
- 308 E Balboa Dr
- 3224 S El Camino Dr
- 915 E Campus Dr
- 223 E Concorda Dr
- 921 E Campus Dr
- 200 E Southern Ave Unit 160
- 200 E Southern Ave Unit 242
- 304 E Concorda Dr
- 1022 E Wesleyan Dr
- 3 E Erie Dr
- 2227 S Sierra Vista Dr
- 1065 E Fairmont Dr Unit 2
- 644 E La Jolla Dr
- 2710 S Terrace Rd
- 206 E Manhatton Dr
- 16 W Loma Vista Dr Unit 104
- 928 E La Jolla Dr
- 507 E Del Rio Dr
- 502 E Erie Dr
- 424 E Erie Dr
- 513 E Del Rio Dr
- 419 E Del Rio Dr
- 428 E Del Rio Dr
- 510 E Erie Dr
- 504 E Del Rio Dr
- 422 E Del Rio Dr
- 418 E Erie Dr
- 510 E Del Rio Dr
- 516 E Erie Dr
- 519 E Del Rio Dr
- 413 E Del Rio Dr
- 416 E Del Rio Dr
- 516 E Del Rio Dr
- 412 E Erie Dr
- 427 E Erie Dr Unit 1
- 513 E Balboa Dr
- 505 E Erie Dr
Your Personal Tour Guide
Ask me questions while you tour the home.