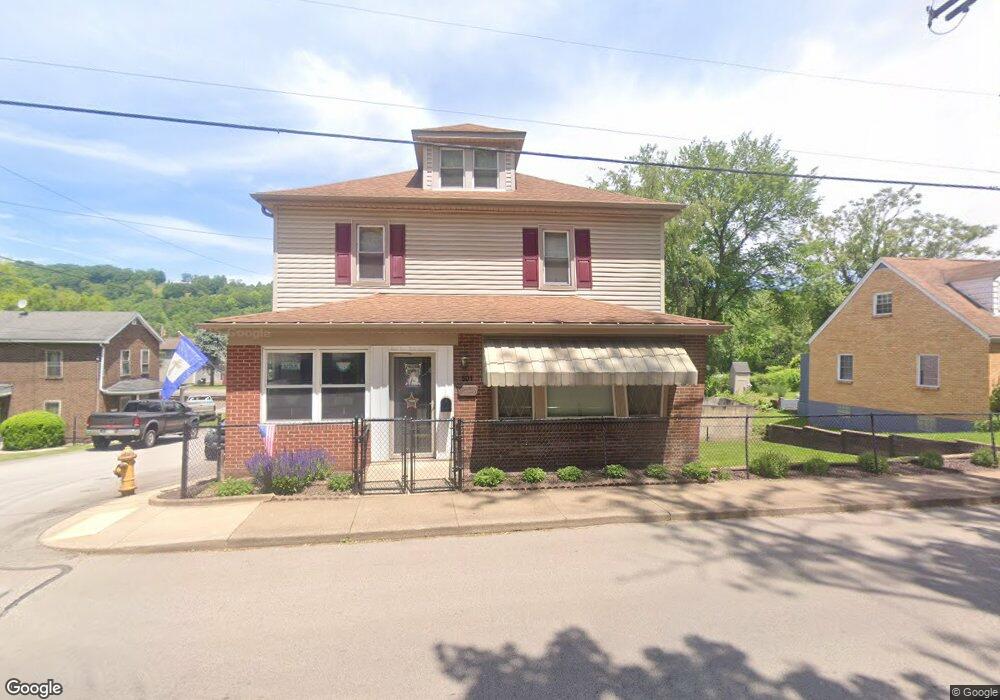
501 E Main St Monongahela, PA 15063
Estimated Value: $63,000 - $148,000
2
Beds
3
Baths
994
Sq Ft
$95/Sq Ft
Est. Value
About This Home
This home is located at 501 E Main St, Monongahela, PA 15063 and is currently estimated at $94,641, approximately $95 per square foot. 501 E Main St is a home located in Washington County with nearby schools including Ringgold High School and Madonna Catholic Regional School.
Ownership History
Date
Name
Owned For
Owner Type
Purchase Details
Closed on
Feb 9, 2026
Sold by
B & M Invest Llc
Bought by
Summit Vale Llc
Current Estimated Value
Purchase Details
Closed on
Sep 24, 2025
Sold by
Washington County Tax Claim Bureau
Bought by
B & M Invest Llc
Purchase Details
Closed on
Nov 22, 2021
Sold by
Gray Charles A
Bought by
Gray Eric A
Purchase Details
Closed on
Oct 4, 2012
Sold by
Bertolina Ronald L and Timko Daniel
Bought by
Gray Charles A
Create a Home Valuation Report for This Property
The Home Valuation Report is an in-depth analysis detailing your home's value as well as a comparison with similar homes in the area
Home Values in the Area
Average Home Value in this Area
Purchase History
| Date | Buyer | Sale Price | Title Company |
|---|---|---|---|
| Summit Vale Llc | $18,500 | None Listed On Document | |
| B & M Invest Llc | $16,250 | None Listed On Document | |
| Gray Eric A | -- | None Available | |
| Gray Charles A | $28,519 | -- |
Source: Public Records
Tax History
| Year | Tax Paid | Tax Assessment Tax Assessment Total Assessment is a certain percentage of the fair market value that is determined by local assessors to be the total taxable value of land and additions on the property. | Land | Improvement |
|---|---|---|---|---|
| 2025 | $1,577 | $53,200 | $12,300 | $40,900 |
| 2024 | $1,309 | $53,200 | $12,300 | $40,900 |
| 2023 | $1,309 | $53,200 | $12,300 | $40,900 |
| 2022 | $1,287 | $53,200 | $12,300 | $40,900 |
| 2021 | $1,274 | $53,200 | $12,300 | $40,900 |
| 2020 | $1,253 | $53,200 | $12,300 | $40,900 |
| 2019 | $1,242 | $53,200 | $12,300 | $40,900 |
| 2018 | $1,205 | $53,200 | $12,300 | $40,900 |
| 2017 | $104 | $53,200 | $12,300 | $40,900 |
| 2016 | $104 | $4,194 | $352 | $3,842 |
| 2015 | -- | $4,194 | $352 | $3,842 |
| 2014 | $104 | $4,194 | $352 | $3,842 |
| 2013 | $104 | $4,194 | $352 | $3,842 |
Source: Public Records
Map
Nearby Homes
Your Personal Tour Guide
Ask me questions while you tour the home.