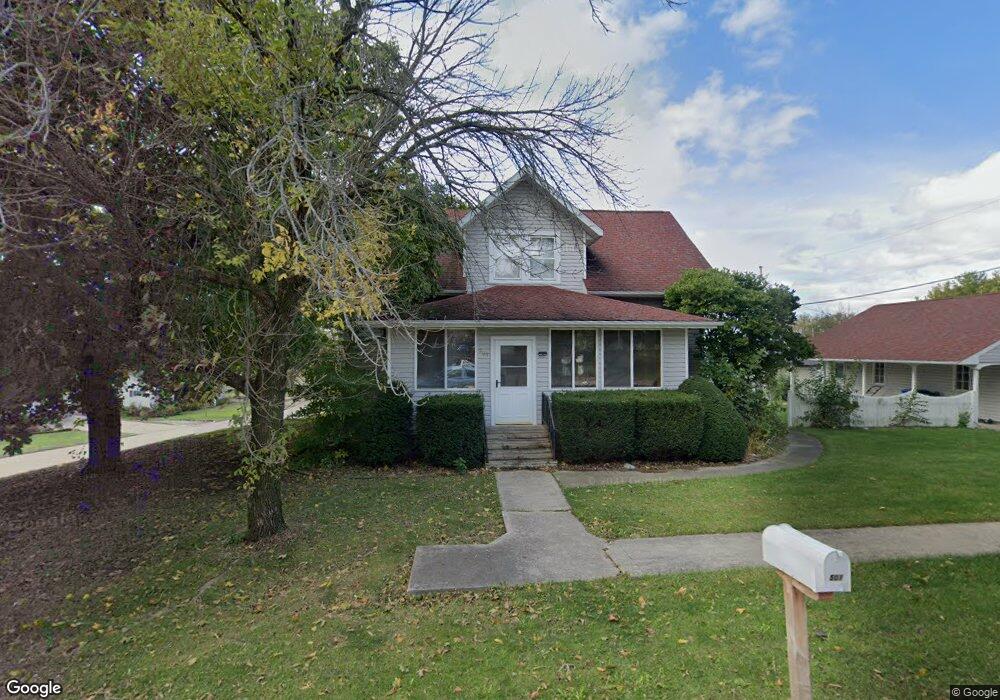
501 Franklin St Victor, IA 52347
Estimated Value: $120,228 - $215,000
4
Beds
2
Baths
1,663
Sq Ft
$91/Sq Ft
Est. Value
About This Home
This home is located at 501 Franklin St, Victor, IA 52347 and is currently estimated at $150,557, approximately $90 per square foot. 501 Franklin St is a home.
Ownership History
Date
Name
Owned For
Owner Type
Purchase Details
Closed on
Sep 14, 2015
Sold by
Johnson Sarah L and Johnson Matthew M
Bought by
Wenman David C
Current Estimated Value
Home Financials for this Owner
Home Financials are based on the most recent Mortgage that was taken out on this home.
Original Mortgage
$90,000
Outstanding Balance
$70,906
Interest Rate
4%
Mortgage Type
Adjustable Rate Mortgage/ARM
Estimated Equity
$79,651
Purchase Details
Closed on
Sep 22, 2008
Sold by
Weisskopf Jeffrey Scott and Weisskopf Justine Lea
Bought by
Weissopf Sarah L and Johnson Matthew M
Home Financials for this Owner
Home Financials are based on the most recent Mortgage that was taken out on this home.
Original Mortgage
$70,000
Interest Rate
6.55%
Mortgage Type
Purchase Money Mortgage
Create a Home Valuation Report for This Property
The Home Valuation Report is an in-depth analysis detailing your home's value as well as a comparison with similar homes in the area
Home Values in the Area
Average Home Value in this Area
Purchase History
| Date | Buyer | Sale Price | Title Company |
|---|---|---|---|
| Wenman David C | $100,000 | None Available | |
| Weissopf Sarah L | $82,500 | None Available |
Source: Public Records
Mortgage History
| Date | Status | Borrower | Loan Amount |
|---|---|---|---|
| Open | Wenman David C | $90,000 | |
| Previous Owner | Weissopf Sarah L | $70,000 |
Source: Public Records
Tax History Compared to Growth
Tax History
| Year | Tax Paid | Tax Assessment Tax Assessment Total Assessment is a certain percentage of the fair market value that is determined by local assessors to be the total taxable value of land and additions on the property. | Land | Improvement |
|---|---|---|---|---|
| 2024 | $1,322 | $93,270 | $13,110 | $80,160 |
| 2023 | $1,286 | $93,270 | $13,110 | $80,160 |
| 2022 | $1,256 | $78,190 | $13,110 | $65,080 |
| 2021 | $1,376 | $78,190 | $13,110 | $65,080 |
| 2020 | $1,336 | $80,370 | $11,970 | $68,400 |
| 2019 | $1,356 | $80,370 | $11,970 | $68,400 |
| 2018 | $1,294 | $78,730 | $10,830 | $67,900 |
| 2017 | $1,294 | $77,620 | $10,830 | $66,790 |
| 2016 | $1,222 | $75,430 | $10,830 | $64,600 |
| 2015 | -- | $75,430 | $10,830 | $64,600 |
| 2014 | -- | $80,020 | $10,830 | $69,190 |
Source: Public Records
Map
Nearby Homes