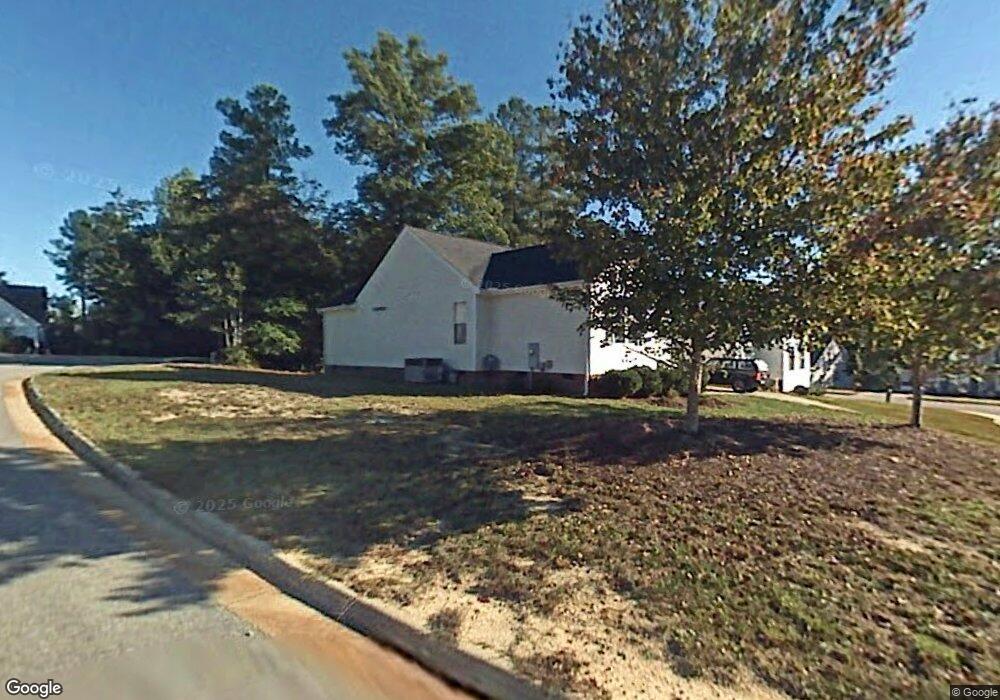
501 Gem Dr Knightdale, NC 27545
Estimated Value: $296,000 - $321,000
3
Beds
2
Baths
1,330
Sq Ft
$234/Sq Ft
Est. Value
About This Home
This home is located at 501 Gem Dr, Knightdale, NC 27545 and is currently estimated at $311,749, approximately $234 per square foot. 501 Gem Dr is a home located in Wake County with nearby schools including Forestville Road Elementary School, Neuse River Middle School, and Knightdale High.
Ownership History
Date
Name
Owned For
Owner Type
Purchase Details
Closed on
Aug 25, 2015
Sold by
Allen Bruce Nicholas and Allen Karla
Bought by
Allen Bruce Nicholas
Current Estimated Value
Purchase Details
Closed on
Mar 8, 2010
Sold by
Clemenson Angela D and Clemenson Oneil Sylvester
Bought by
Allen Bruce Nicholas and Allen Karla
Home Financials for this Owner
Home Financials are based on the most recent Mortgage that was taken out on this home.
Original Mortgage
$141,836
Outstanding Balance
$93,959
Interest Rate
4.97%
Mortgage Type
New Conventional
Estimated Equity
$217,790
Purchase Details
Closed on
Nov 11, 1999
Sold by
Legacy Construction Inc
Bought by
Chambers Angela D
Home Financials for this Owner
Home Financials are based on the most recent Mortgage that was taken out on this home.
Original Mortgage
$117,300
Interest Rate
7.7%
Mortgage Type
VA
Purchase Details
Closed on
Nov 10, 1998
Sold by
Jerry Gower Construction Company Inc
Bought by
Legacy Construction Inc
Create a Home Valuation Report for This Property
The Home Valuation Report is an in-depth analysis detailing your home's value as well as a comparison with similar homes in the area
Home Values in the Area
Average Home Value in this Area
Purchase History
| Date | Buyer | Sale Price | Title Company |
|---|---|---|---|
| Allen Bruce Nicholas | -- | Chicago Title Insurance Co | |
| Allen Bruce Nicholas | $139,000 | None Available | |
| Chambers Angela D | $115,000 | -- | |
| Legacy Construction Inc | $50,000 | -- |
Source: Public Records
Mortgage History
| Date | Status | Borrower | Loan Amount |
|---|---|---|---|
| Open | Allen Bruce Nicholas | $141,836 | |
| Previous Owner | Chambers Angela D | $117,300 |
Source: Public Records
Tax History Compared to Growth
Tax History
| Year | Tax Paid | Tax Assessment Tax Assessment Total Assessment is a certain percentage of the fair market value that is determined by local assessors to be the total taxable value of land and additions on the property. | Land | Improvement |
|---|---|---|---|---|
| 2025 | $2,832 | $293,804 | $85,000 | $208,804 |
| 2024 | $2,821 | $293,804 | $85,000 | $208,804 |
| 2023 | $2,087 | $186,721 | $40,000 | $146,721 |
| 2022 | $2,017 | $186,721 | $40,000 | $146,721 |
| 2021 | $1,925 | $186,721 | $40,000 | $146,721 |
| 2020 | $1,925 | $186,721 | $40,000 | $146,721 |
| 2019 | $1,645 | $141,211 | $35,000 | $106,211 |
| 2018 | $1,551 | $141,211 | $35,000 | $106,211 |
| 2017 | $1,496 | $141,211 | $35,000 | $106,211 |
| 2016 | $1,475 | $141,211 | $35,000 | $106,211 |
| 2015 | $1,506 | $142,300 | $35,000 | $107,300 |
| 2014 | $1,454 | $142,300 | $35,000 | $107,300 |
Source: Public Records
Map
Nearby Homes
- 402 Gem Dr
- 317 Aqua Marine Ln
- 1021 Clove Pine Dr
- 528 Sweet Pine Ln
- 564 Lemon Daisy Ln
- 568 Lemon Daisy Ln
- 704 Old Knight Rd
- 572 Lemon Daisy Ln
- 552 Lemon Daisy Ln
- 565 Lemon Daisy Ln
- 569 Lemon Daisy Ln
- 561 Lemon Daisy Ln
- 557 Lemon Daisy Ln
- 553 Lemon Daisy Ln
- 928 Bostonian Dr
- 549 Lemon Daisy Ln
- 920 Bostonian Dr
- 577 Lemon Daisy Ln
- 545 Lemon Daisy Ln
- 541 Lemon Daisy Ln