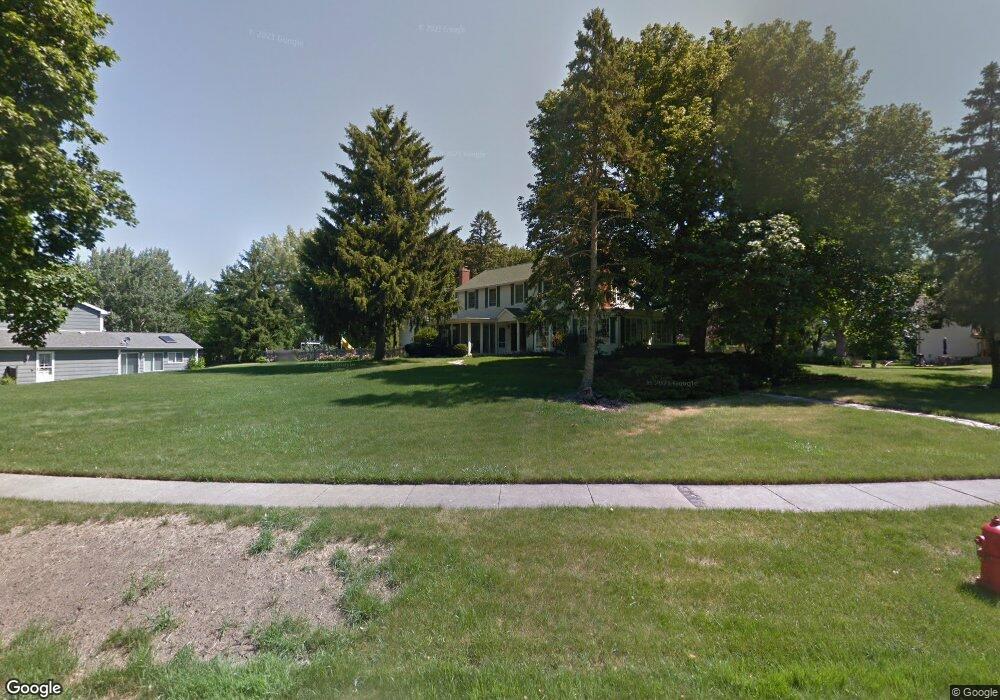
501 Kings Way Mundelein, IL 60060
Tullamore NeighborhoodEstimated Value: $534,000 - $644,000
4
Beds
3
Baths
3,410
Sq Ft
$167/Sq Ft
Est. Value
About This Home
This home is located at 501 Kings Way, Mundelein, IL 60060 and is currently estimated at $568,852, approximately $166 per square foot. 501 Kings Way is a home located in Lake County with nearby schools including Fremont Elementary School, Fremont Intermediate School, and Fremont Jr High/Middle School.
Ownership History
Date
Name
Owned For
Owner Type
Purchase Details
Closed on
May 16, 2017
Sold by
Duffy Laura A
Bought by
Duffy Laura A and The Laura A Duffy Trust
Current Estimated Value
Purchase Details
Closed on
Mar 31, 2015
Sold by
Duffy Peter F and Duffy Laura A
Bought by
Duffy Laura A
Home Financials for this Owner
Home Financials are based on the most recent Mortgage that was taken out on this home.
Original Mortgage
$241,000
Outstanding Balance
$184,713
Interest Rate
3.62%
Mortgage Type
New Conventional
Estimated Equity
$384,139
Purchase Details
Closed on
Oct 27, 1995
Sold by
Neiman Gary G and Neiman Judith K
Bought by
Duffy Peter F and Duffy Laura A
Home Financials for this Owner
Home Financials are based on the most recent Mortgage that was taken out on this home.
Original Mortgage
$211,200
Interest Rate
7.25%
Create a Home Valuation Report for This Property
The Home Valuation Report is an in-depth analysis detailing your home's value as well as a comparison with similar homes in the area
Home Values in the Area
Average Home Value in this Area
Purchase History
| Date | Buyer | Sale Price | Title Company |
|---|---|---|---|
| Duffy Laura A | -- | None Available | |
| Duffy Laura A | -- | Attorney | |
| Duffy Laura A | -- | Fidelity National Title | |
| Duffy Peter F | $264,000 | -- |
Source: Public Records
Mortgage History
| Date | Status | Borrower | Loan Amount |
|---|---|---|---|
| Open | Duffy Laura A | $241,000 | |
| Closed | Duffy Peter F | $211,200 |
Source: Public Records
Tax History Compared to Growth
Tax History
| Year | Tax Paid | Tax Assessment Tax Assessment Total Assessment is a certain percentage of the fair market value that is determined by local assessors to be the total taxable value of land and additions on the property. | Land | Improvement |
|---|---|---|---|---|
| 2024 | $10,566 | $135,429 | $30,207 | $105,222 |
| 2023 | $10,192 | $124,087 | $27,677 | $96,410 |
| 2022 | $10,192 | $117,105 | $32,261 | $84,844 |
| 2021 | $9,742 | $113,003 | $31,131 | $81,872 |
| 2020 | $9,767 | $109,893 | $30,274 | $79,619 |
| 2019 | $9,441 | $106,280 | $29,279 | $77,001 |
| 2018 | $8,923 | $101,871 | $30,849 | $71,022 |
| 2017 | $8,829 | $98,664 | $29,878 | $68,786 |
| 2016 | $8,626 | $93,707 | $28,377 | $65,330 |
| 2015 | $8,467 | $87,848 | $26,603 | $61,245 |
| 2014 | $8,137 | $84,948 | $25,465 | $59,483 |
| 2012 | $8,282 | $85,702 | $25,691 | $60,011 |
Source: Public Records
Map
Nearby Homes
- 1730 Savannah Cir
- 1664 Brighton Dr
- 1632 Brighton Dr
- 3174 Comstock Ct
- 3184 Comstock Ct
- 123 Dunton Ct
- 2982 Ravinia Cir
- 191 Springbrook Ct
- 201 Bingham Cir
- 3162 Eastbank Cir
- 1021 Wrens Gate
- 1349 Spalding Dr
- 28884 N Il Route 83
- 1010 Evergreen St Unit 3
- 1067 Kessler Dr
- 26220 N Midlothian Rd
- 1066 Kessler Dr
- 1520 Trescott St
- 1146 Kessler Dr
- 1156 Kessler Dr