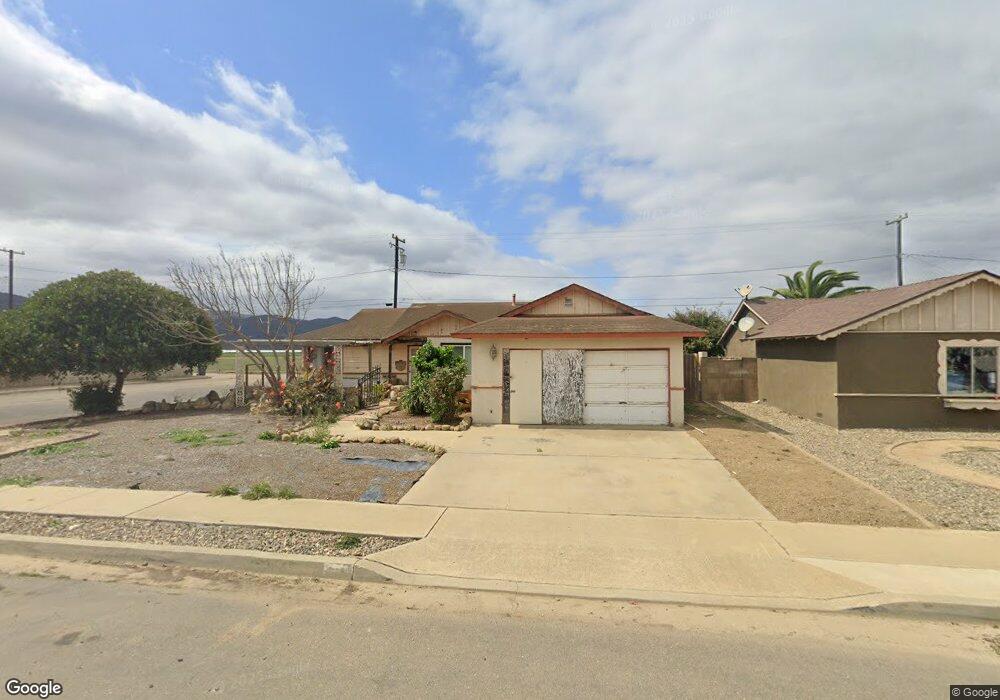
501 N Z St Lompoc, CA 93436
Estimated Value: $510,992 - $586,000
3
Beds
2
Baths
1,379
Sq Ft
$397/Sq Ft
Est. Value
About This Home
This home is located at 501 N Z St, Lompoc, CA 93436 and is currently estimated at $547,498, approximately $397 per square foot. 501 N Z St is a home located in Santa Barbara County with nearby schools including Clarence Ruth Elementary School, Lompoc Valley Middle School, and Lompoc High School.
Ownership History
Date
Name
Owned For
Owner Type
Purchase Details
Closed on
May 9, 2015
Sold by
Goodman Terry Lynn
Bought by
Goodman Terry L
Current Estimated Value
Purchase Details
Closed on
Jul 29, 2004
Sold by
Goodman Charles
Bought by
Goodman Terry Lynn
Home Financials for this Owner
Home Financials are based on the most recent Mortgage that was taken out on this home.
Original Mortgage
$60,000
Outstanding Balance
$30,088
Interest Rate
6.17%
Mortgage Type
Stand Alone First
Estimated Equity
$517,410
Purchase Details
Closed on
Jul 28, 2004
Sold by
Goodman Terry Lynn and Shaffer Terry Lynn
Bought by
Goodman Terry Lynn
Home Financials for this Owner
Home Financials are based on the most recent Mortgage that was taken out on this home.
Original Mortgage
$60,000
Outstanding Balance
$30,088
Interest Rate
6.17%
Mortgage Type
Stand Alone First
Estimated Equity
$517,410
Purchase Details
Closed on
Feb 23, 1995
Sold by
Kelley Cheryn
Bought by
Schaffer Terry Lynn
Create a Home Valuation Report for This Property
The Home Valuation Report is an in-depth analysis detailing your home's value as well as a comparison with similar homes in the area
Home Values in the Area
Average Home Value in this Area
Purchase History
| Date | Buyer | Sale Price | Title Company |
|---|---|---|---|
| Goodman Terry L | -- | None Available | |
| Goodman Terry Lynn | -- | Fidelity National Title Co | |
| Goodman Terry Lynn | -- | Fidelity National Title Co | |
| Schaffer Terry Lynn | -- | -- |
Source: Public Records
Mortgage History
| Date | Status | Borrower | Loan Amount |
|---|---|---|---|
| Open | Goodman Terry Lynn | $60,000 | |
| Closed | Goodman Terry Lynn | $60,000 |
Source: Public Records
Tax History
| Year | Tax Paid | Tax Assessment Tax Assessment Total Assessment is a certain percentage of the fair market value that is determined by local assessors to be the total taxable value of land and additions on the property. | Land | Improvement |
|---|---|---|---|---|
| 2025 | $3,419 | $312,473 | $72,106 | $240,367 |
| 2023 | $3,419 | $300,341 | $69,307 | $231,034 |
| 2022 | $3,360 | $294,453 | $67,949 | $226,504 |
| 2021 | $3,397 | $288,680 | $66,617 | $222,063 |
| 2020 | $3,361 | $285,721 | $65,934 | $219,787 |
| 2019 | $3,306 | $280,120 | $64,642 | $215,478 |
| 2018 | $3,255 | $274,628 | $63,375 | $211,253 |
| 2017 | $3,196 | $269,244 | $62,133 | $207,111 |
| 2016 | $1,261 | $103,967 | $42,167 | $61,800 |
| 2014 | -- | $100,401 | $40,721 | $59,680 |
Source: Public Records
Map
Nearby Homes
- 1445 Crown Cir
- 1355 Crown Cir
- 516 N U St
- 112 N X St
- 1408 W Walnut Ave
- 1410 W Apricot Ave
- 267 Village Circle Dr
- 60 Village Circle Dr
- 1011 W Walnut Ave
- 23 Village Circle Dr
- 4314 W Ocean Ave
- 531 N O St
- 1012 W Anthony Way
- 1220 W Lime Ave
- 217 N M St
- 901 Alden Ave
- 2020 Green Ridge Cir
- 526 N L St
- 524 Avalon St
- 1328 W Willow Ave
Your Personal Tour Guide
Ask me questions while you tour the home.