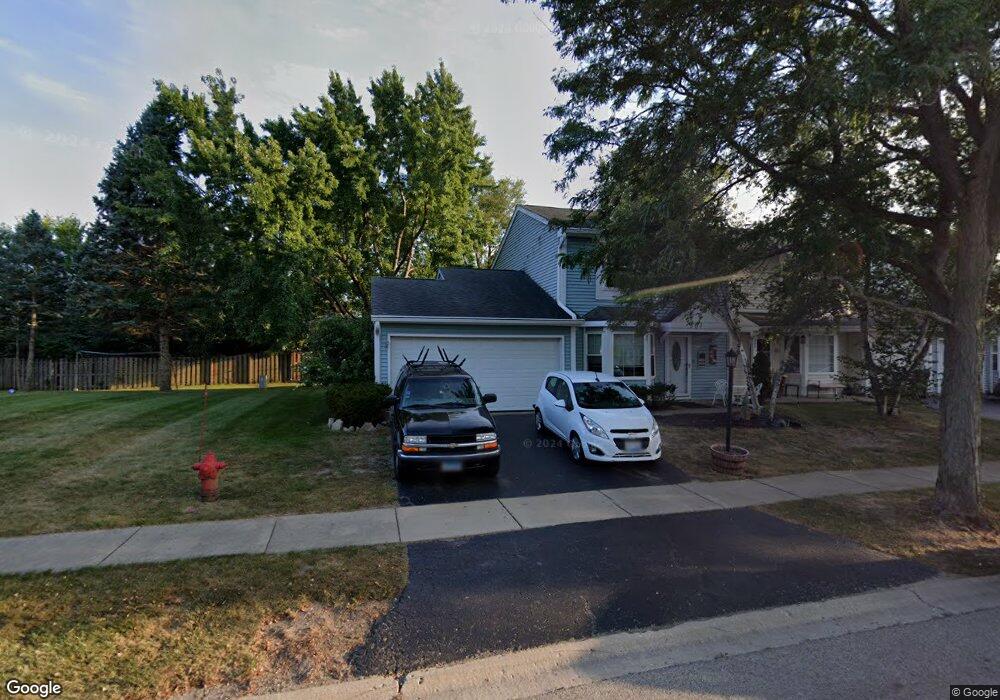
501 Newbury Dr Island Lake, IL 60042
West Island Lake NeighborhoodEstimated Value: $249,246 - $264,000
3
Beds
2
Baths
1,297
Sq Ft
$196/Sq Ft
Est. Value
About This Home
This home is located at 501 Newbury Dr, Island Lake, IL 60042 and is currently estimated at $254,812, approximately $196 per square foot. 501 Newbury Dr is a home located in McHenry County with nearby schools including Cotton Creek School, Matthews Middle School, and Wauconda High School.
Ownership History
Date
Name
Owned For
Owner Type
Purchase Details
Closed on
Feb 26, 2019
Sold by
Divincenzo Vincent and Divincenzo Rosalynne
Bought by
Divincenzo Vincent and Divincenzo Rosalynne Marie
Current Estimated Value
Purchase Details
Closed on
Sep 7, 2010
Sold by
Kufke Richard A
Bought by
Divincenzo Vincent and Divincenzo Rosalynne
Purchase Details
Closed on
Jan 27, 2006
Sold by
Kufke Bernice
Bought by
Kufke Herbert N and Kufke Richard A
Purchase Details
Closed on
Jan 30, 2004
Sold by
Munser Jerry G
Bought by
Kufke Bernice
Purchase Details
Closed on
Jul 31, 2003
Sold by
Mccoy Kenneth O and Mccoy Joan E
Bought by
Munser Jerry G
Home Financials for this Owner
Home Financials are based on the most recent Mortgage that was taken out on this home.
Original Mortgage
$121,800
Interest Rate
5.62%
Mortgage Type
FHA
Purchase Details
Closed on
Aug 17, 2001
Sold by
Srednicki Deron J and Srednicki Kathleen A
Bought by
Mccoy Kenneth O and Mccoy Joan E
Create a Home Valuation Report for This Property
The Home Valuation Report is an in-depth analysis detailing your home's value as well as a comparison with similar homes in the area
Home Values in the Area
Average Home Value in this Area
Purchase History
| Date | Buyer | Sale Price | Title Company |
|---|---|---|---|
| Divincenzo Vincent | -- | Attorney | |
| Divincenzo Vincent | $125,000 | Fidelity Natl Title Ins Co | |
| Kufke Herbert N | -- | None Available | |
| Kufke Richard A | -- | None Available | |
| Kufke Bernice | $156,000 | Absolute Title | |
| Munser Jerry G | $132,000 | -- | |
| Mccoy Kenneth O | $131,900 | -- |
Source: Public Records
Mortgage History
| Date | Status | Borrower | Loan Amount |
|---|---|---|---|
| Previous Owner | Munser Jerry G | $121,800 |
Source: Public Records
Tax History Compared to Growth
Tax History
| Year | Tax Paid | Tax Assessment Tax Assessment Total Assessment is a certain percentage of the fair market value that is determined by local assessors to be the total taxable value of land and additions on the property. | Land | Improvement |
|---|---|---|---|---|
| 2024 | $3,315 | $58,009 | $7,605 | $50,404 |
| 2023 | $3,068 | $52,021 | $6,820 | $45,201 |
| 2022 | $3,902 | $50,165 | $6,237 | $43,928 |
| 2021 | $3,723 | $47,033 | $5,848 | $41,185 |
| 2020 | $3,504 | $45,624 | $5,673 | $39,951 |
| 2019 | $3,418 | $43,377 | $5,394 | $37,983 |
| 2018 | $2,309 | $32,671 | $5,067 | $27,604 |
| 2017 | $2,201 | $31,300 | $4,854 | $26,446 |
| 2016 | $2,099 | $29,863 | $4,631 | $25,232 |
| 2013 | -- | $35,553 | $4,407 | $31,146 |
Source: Public Records
Map
Nearby Homes
- 404 Lauren Ln
- 605 Yale Ln
- 624 Yale Ln Unit 2
- 318 David Ct
- 112 Hazel Ct
- NEC Route 176 & Westridge Dr
- 2610 S Thomas Ct
- Roosevelt - Ranch Plan at Prairie Woods
- Madison - Two-story Plan at Prairie Woods
- Lincoln - Ranch Plan at Prairie Woods
- Monroe II - Two-story Plan at Prairie Woods
- Roosevelt II- Ranch Plan at Prairie Woods
- Montana - Ranch Plan at Prairie Woods
- Dawson - Two-story Plan at Prairie Woods
- Brady II- Ranch Plan at Prairie Woods
- Elway - Ranch Plan at Prairie Woods
- Adams III - Ranch Plan at Prairie Woods
- Harrison - Ranch Plan at Prairie Woods
- Newport - Two-story Plan at Prairie Woods
- Brady - Ranch Plan at Prairie Woods
- 503 Newbury Dr
- 433 Newbury Dr
- 433 Newbury Dr Unit 433
- 507 Newbury Dr
- 438 Newbury Dr
- 436 Newbury Dr
- 436 Newbury Dr Unit 436
- 503 Lauren Ln
- 431 Newbury Dr
- 434 Newbury Dr
- 509 Newbury Dr
- 509 Newbury Dr Unit 509
- 505 Lauren Ln
- 432 Newbury Dr
- 507 Lauren Ln
- 511 Newbury Dr
- 421 Newbury Dr
- 426 Newbury Dr
- 433 Lauren Ln
- 509 Lauren Ln