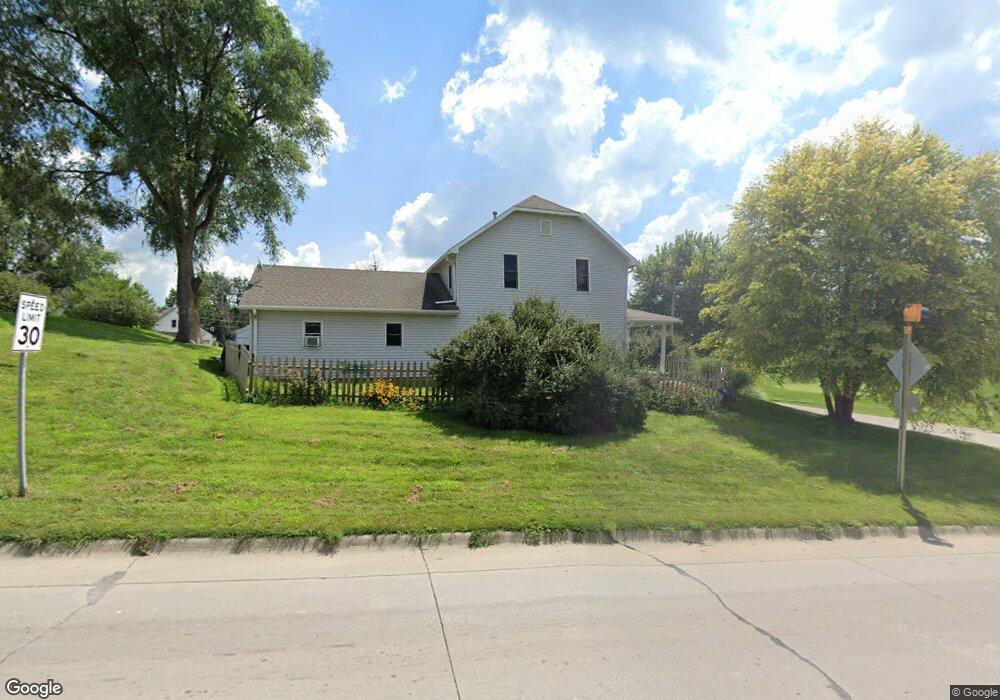
501 Remsen St Dunlap, IA 51529
Estimated Value: $148,000 - $237,000
5
Beds
2
Baths
1,896
Sq Ft
$103/Sq Ft
Est. Value
About This Home
This home is located at 501 Remsen St, Dunlap, IA 51529 and is currently estimated at $195,976, approximately $103 per square foot. 501 Remsen St is a home located in Harrison County with nearby schools including Boyer Valley Elementary School and Boyer Valley Middle/High School.
Ownership History
Date
Name
Owned For
Owner Type
Purchase Details
Closed on
Aug 11, 2011
Sold by
Roberts Tricia Sue and Petersen Tricia Sue
Bought by
Petersen Jay D
Current Estimated Value
Home Financials for this Owner
Home Financials are based on the most recent Mortgage that was taken out on this home.
Original Mortgage
$108,000
Outstanding Balance
$75,021
Interest Rate
4.64%
Mortgage Type
New Conventional
Estimated Equity
$120,955
Purchase Details
Closed on
Jun 17, 2008
Sold by
Melby Wayne and Melby Karen A
Bought by
Petersen Jay D
Home Financials for this Owner
Home Financials are based on the most recent Mortgage that was taken out on this home.
Original Mortgage
$110,600
Interest Rate
6.04%
Mortgage Type
New Conventional
Create a Home Valuation Report for This Property
The Home Valuation Report is an in-depth analysis detailing your home's value as well as a comparison with similar homes in the area
Home Values in the Area
Average Home Value in this Area
Purchase History
| Date | Buyer | Sale Price | Title Company |
|---|---|---|---|
| Petersen Jay D | -- | None Available | |
| Petersen Jay D | $138,500 | None Available |
Source: Public Records
Mortgage History
| Date | Status | Borrower | Loan Amount |
|---|---|---|---|
| Open | Petersen Jay D | $108,000 | |
| Closed | Petersen Jay D | $110,600 |
Source: Public Records
Tax History Compared to Growth
Tax History
| Year | Tax Paid | Tax Assessment Tax Assessment Total Assessment is a certain percentage of the fair market value that is determined by local assessors to be the total taxable value of land and additions on the property. | Land | Improvement |
|---|---|---|---|---|
| 2025 | $3,114 | $201,400 | $23,270 | $178,130 |
| 2024 | $3,114 | $183,190 | $23,270 | $159,920 |
| 2023 | $2,988 | $183,190 | $23,270 | $159,920 |
| 2022 | $2,876 | $159,363 | $23,270 | $136,093 |
| 2021 | $2,876 | $159,363 | $23,270 | $136,093 |
| 2020 | $2,568 | $135,837 | $23,270 | $112,567 |
| 2019 | $2,428 | $135,837 | $23,270 | $112,567 |
| 2018 | $2,412 | $121,319 | $0 | $0 |
| 2017 | $2,412 | $121,319 | $0 | $0 |
| 2016 | $2,446 | $121,319 | $0 | $0 |
| 2015 | $2,446 | $109,296 | $0 | $0 |
| 2014 | $2,022 | $109,296 | $0 | $0 |
Source: Public Records
Map
Nearby Homes