Estimated Value: $112,772
Studio
--
Bath
4,300
Sq Ft
$26/Sq Ft
Est. Value
About This Home
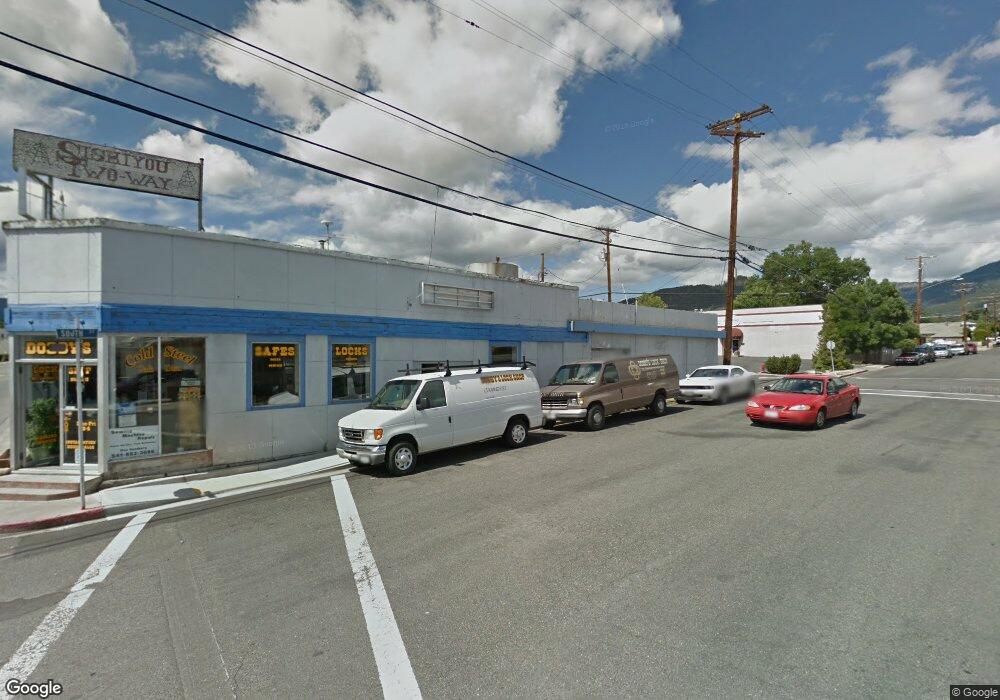
This home is located at 501 S Main St, Yreka, CA 96097 and is currently estimated at $112,772, approximately $26 per square foot. 501 S Main St is a home located in Siskiyou County with nearby schools including Evergreen Elementary School, Jackson Street Elementary School, and Yreka High School.
Ownership History
Date
Name
Owned For
Owner Type
Purchase Details
Closed on
Jan 23, 2026
Sold by
Golden Arrow Investments Llc
Bought by
Scott River Properties Llc
Current Estimated Value
Purchase Details
Closed on
Dec 30, 2025
Sold by
Golden Arrow Investments Llc
Bought by
Golden Arrow Investments Llc
Purchase Details
Closed on
Nov 24, 2020
Sold by
Golden Arrow Investments Llc
Bought by
Department Of Transportation
Purchase Details
Closed on
Feb 12, 2019
Sold by
Whipple Todd W and Whipple Stacey R
Bought by
Golden Arrow Investments Llc
Purchase Details
Closed on
Jul 15, 2018
Sold by
Davenport Edwin L and Davenport Jean M
Bought by
Whipple Todd W and Whipple Stacey R
Purchase Details
Closed on
Aug 18, 2015
Sold by
Pohard Donald Gratton
Bought by
Davenport Edwin L and Davenport Jean M
Purchase Details
Closed on
Jul 28, 2009
Sold by
Pollard Donald G
Bought by
Pollard Donald Gratton
Create a Home Valuation Report for This Property
The Home Valuation Report is an in-depth analysis detailing your home's value as well as a comparison with similar homes in the area
Home Values in the Area
Average Home Value in this Area
Purchase History
| Date | Buyer | Sale Price | Title Company |
|---|---|---|---|
| Scott River Properties Llc | $292,500 | Mt Shasta Title And Escrow Co | |
| Golden Arrow Investments Llc | -- | Mt Shasta Title And Escrow Co | |
| Department Of Transportation | -- | None Available | |
| Golden Arrow Investments Llc | -- | None Available | |
| Whipple Todd W | $65,000 | Mt Shasta Title & Escrow | |
| Davenport Edwin L | $10,000 | Orange Coast Title Company | |
| Pollard Donald Gratton | -- | None Available |
Source: Public Records
Tax History
| Year | Tax Paid | Tax Assessment Tax Assessment Total Assessment is a certain percentage of the fair market value that is determined by local assessors to be the total taxable value of land and additions on the property. | Land | Improvement |
|---|---|---|---|---|
| 2025 | $743 | $72,503 | $27,886 | $44,617 |
| 2023 | $743 | $69,690 | $26,804 | $42,886 |
| 2022 | $715 | $68,325 | $26,279 | $42,046 |
| 2021 | $703 | $66,986 | $25,764 | $41,222 |
| 2020 | $698 | $66,300 | $25,500 | $40,800 |
| 2019 | $686 | $65,000 | $25,000 | $40,000 |
| 2018 | $978 | $92,595 | $31,212 | $61,383 |
| 2017 | $959 | $90,780 | $30,600 | $60,180 |
| 2016 | $937 | $89,000 | $30,000 | $59,000 |
| 2015 | $1,305 | $123,970 | $45,911 | $78,059 |
| 2014 | $1,258 | $121,542 | $45,012 | $76,530 |
Source: Public Records
Map
Nearby Homes
Your Personal Tour Guide
Ask me questions while you tour the home.