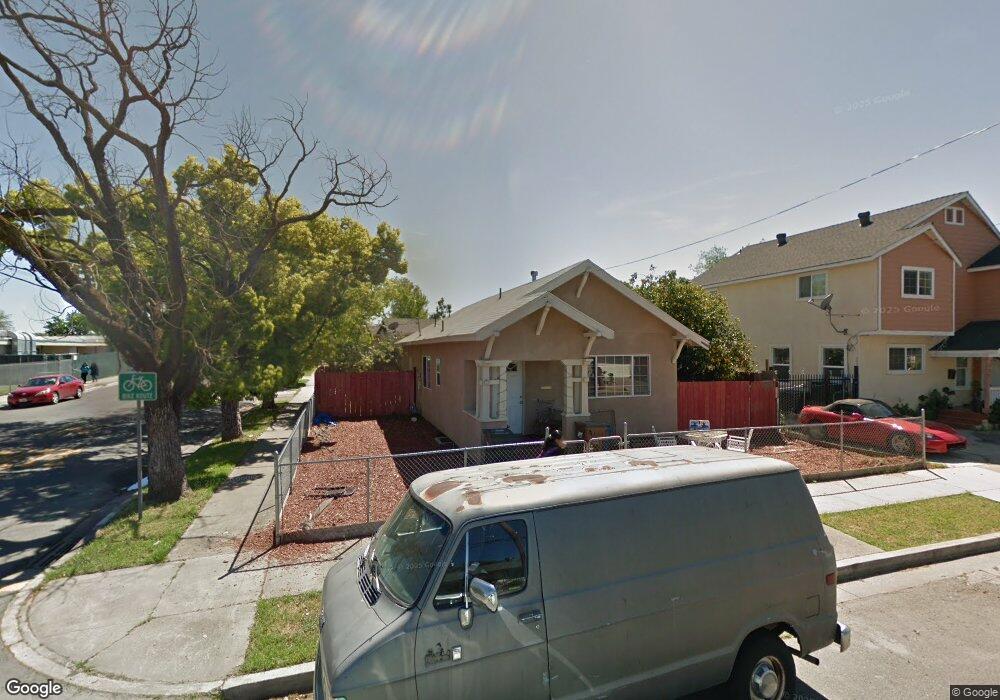
501 W 13th St Antioch, CA 94509
North Antioch NeighborhoodEstimated Value: $383,000 - $507,000
3
Beds
2
Baths
983
Sq Ft
$437/Sq Ft
Est. Value
About This Home
This home is located at 501 W 13th St, Antioch, CA 94509 and is currently estimated at $429,795, approximately $437 per square foot. 501 W 13th St is a home located in Contra Costa County with nearby schools including Fremont Elementary School, Antioch Middle School, and Antioch High School.
Ownership History
Date
Name
Owned For
Owner Type
Purchase Details
Closed on
Dec 28, 2021
Sold by
Ceja Javier and Ceja Patricia
Bought by
Ceja Javier and Ceja Patricia C
Current Estimated Value
Home Financials for this Owner
Home Financials are based on the most recent Mortgage that was taken out on this home.
Original Mortgage
$300,000
Interest Rate
3.11%
Mortgage Type
New Conventional
Purchase Details
Closed on
Jul 20, 2005
Sold by
Benites Benjamin
Bought by
Benites Benjamin and Ceja Javier
Create a Home Valuation Report for This Property
The Home Valuation Report is an in-depth analysis detailing your home's value as well as a comparison with similar homes in the area
Home Values in the Area
Average Home Value in this Area
Purchase History
| Date | Buyer | Sale Price | Title Company |
|---|---|---|---|
| Ceja Javier | -- | Fidelity National Title Co | |
| Benites Benjamin | -- | -- |
Source: Public Records
Mortgage History
| Date | Status | Borrower | Loan Amount |
|---|---|---|---|
| Closed | Ceja Javier | $300,000 |
Source: Public Records
Tax History Compared to Growth
Tax History
| Year | Tax Paid | Tax Assessment Tax Assessment Total Assessment is a certain percentage of the fair market value that is determined by local assessors to be the total taxable value of land and additions on the property. | Land | Improvement |
|---|---|---|---|---|
| 2025 | $1,974 | $131,676 | $48,790 | $82,886 |
| 2024 | $1,915 | $129,095 | $47,834 | $81,261 |
| 2023 | $1,915 | $126,565 | $46,897 | $79,668 |
| 2022 | $1,891 | $124,084 | $45,978 | $78,106 |
| 2021 | $1,817 | $121,652 | $45,077 | $76,575 |
| 2019 | $1,774 | $118,045 | $43,741 | $74,304 |
| 2018 | $1,711 | $115,732 | $42,884 | $72,848 |
| 2017 | $1,662 | $113,464 | $42,044 | $71,420 |
| 2016 | $1,610 | $111,240 | $41,220 | $70,020 |
| 2015 | $1,997 | $109,570 | $40,601 | $68,969 |
| 2014 | $1,943 | $107,424 | $39,806 | $67,618 |
Source: Public Records
Map
Nearby Homes