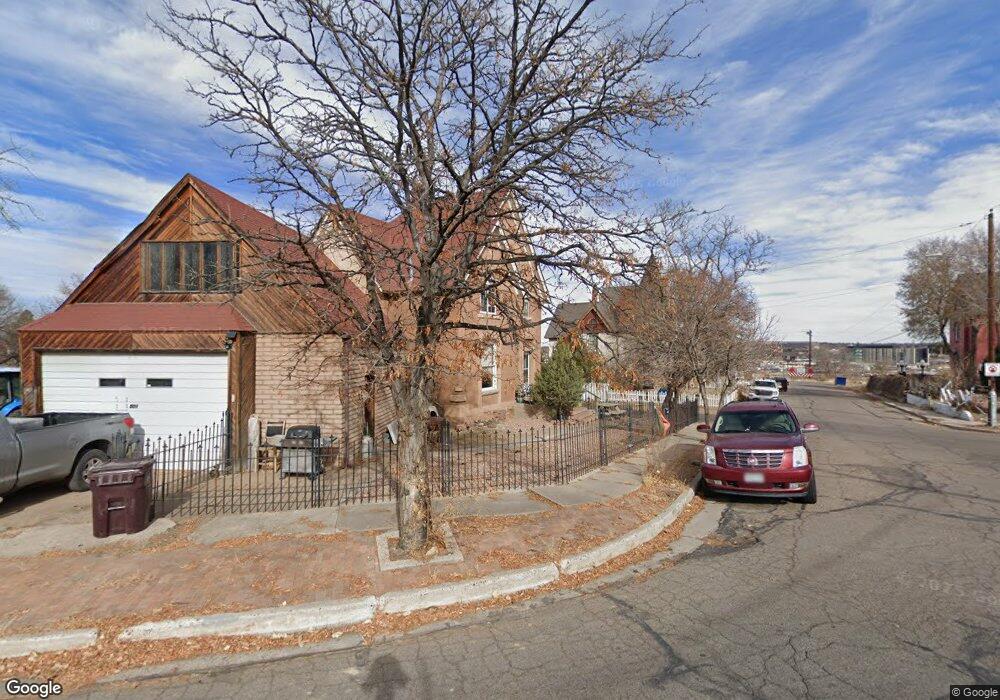
501 W Corona Ave Pueblo, CO 81004
Mesa Junction NeighborhoodEstimated Value: $224,956 - $250,000
3
Beds
1
Bath
1,404
Sq Ft
$172/Sq Ft
Est. Value
About This Home
This home is located at 501 W Corona Ave, Pueblo, CO 81004 and is currently estimated at $241,489, approximately $172 per square foot. 501 W Corona Ave is a home located in Pueblo County with nearby schools including Carlile Elementary School, Columbian Elementary School, and Pueblo Academy of Arts.
Ownership History
Date
Name
Owned For
Owner Type
Purchase Details
Closed on
Aug 27, 2012
Sold by
Macartney Susan M
Bought by
Kennedy John Adam and Kennedy John D
Current Estimated Value
Home Financials for this Owner
Home Financials are based on the most recent Mortgage that was taken out on this home.
Original Mortgage
$78,551
Outstanding Balance
$54,354
Interest Rate
3.57%
Mortgage Type
FHA
Estimated Equity
$187,135
Purchase Details
Closed on
Jul 27, 2010
Sold by
Macartney Susan M
Bought by
Macartney Susan M
Purchase Details
Closed on
Mar 19, 2004
Sold by
Caple
Bought by
Caple Frances M
Purchase Details
Closed on
May 28, 1997
Sold by
Hasenack Mike L
Bought by
Caple Kenneth E
Purchase Details
Closed on
Oct 31, 1984
Sold by
Hasenack Herman A + Helen A
Bought by
Hasenack Mike L
Purchase Details
Closed on
Jul 25, 1979
Bought by
Hasenack Herman A + Helen A
Create a Home Valuation Report for This Property
The Home Valuation Report is an in-depth analysis detailing your home's value as well as a comparison with similar homes in the area
Home Values in the Area
Average Home Value in this Area
Purchase History
| Date | Buyer | Sale Price | Title Company |
|---|---|---|---|
| Kennedy John Adam | $80,000 | Fidelity National Title Insu | |
| Macartney Susan M | -- | None Available | |
| Caple Frances M | -- | -- | |
| Caple Kenneth E | $75,000 | -- | |
| Hasenack Mike L | $31,000 | -- | |
| Hasenack Herman A + Helen A | $18,000 | -- |
Source: Public Records
Mortgage History
| Date | Status | Borrower | Loan Amount |
|---|---|---|---|
| Open | Kennedy John Adam | $78,551 |
Source: Public Records
Tax History Compared to Growth
Tax History
| Year | Tax Paid | Tax Assessment Tax Assessment Total Assessment is a certain percentage of the fair market value that is determined by local assessors to be the total taxable value of land and additions on the property. | Land | Improvement |
|---|---|---|---|---|
| 2024 | $1,206 | $12,290 | -- | -- |
| 2023 | $1,219 | $15,980 | $670 | $15,310 |
| 2022 | $1,178 | $11,870 | $310 | $11,560 |
| 2021 | $1,216 | $12,210 | $320 | $11,890 |
| 2020 | $677 | $12,210 | $320 | $11,890 |
| 2019 | $678 | $6,711 | $260 | $6,451 |
| 2018 | $514 | $5,676 | $261 | $5,415 |
| 2017 | $519 | $5,676 | $261 | $5,415 |
| 2016 | $516 | $5,683 | $289 | $5,394 |
| 2015 | $514 | $5,683 | $289 | $5,394 |
| 2014 | $575 | $6,343 | $289 | $6,054 |
Source: Public Records
Map
Nearby Homes
- TBD Neilson
- 119 Idaho Ave
- 624 W Corona Ave
- 119 Jewell Ave
- 716 W Corona Ave
- 118 Polk St
- 710 Wilson Ave
- 124 Lincoln St
- 226 W Abriendo Ave
- 125 Jackson St
- 222 W Abriendo Ave Unit 224
- 218 Polk St
- 603 W Routt Ave Unit A & B
- 603 W Routt Ave Unit 2
- 113 Midway Ave
- 113 Midway Ave Unit 117
- 201 Lamkin St Unit 106
- 201 Lamkin St Unit 204
- 511 W Pitkin Ave
- 121 Garfield St
- 503 W Corona Ave
- 207 Howard Ave
- 202 Howard Ave
- 211 Howard Ave
- 553 Pearl St
- 204 Howard Ave
- 217 Howard Ave
- 217 Howard Ave Unit 2
- 217 Howard Ave Unit 1
- 555 Pearl St Unit 559
- 555 Pearl St Unit 555-559
- 0 Corona Unit 9-11 104977
- 0 Corona Unit 9-11 101706
- 0 Corona Unit 9-11 95905
- 0 Corona Unit 118918
- 0 Corona Unit 118916
- 423 W Corona Ave
- 518 W Corona Ave
- 221 Howard Ave Unit 7 &
- 525 W Corona Ave