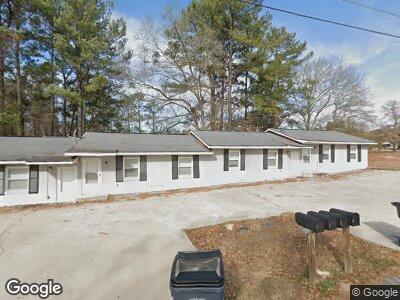
501 Weaver St Unit 3 Spring Lake, NC 28390
Estimated Value: $266,000 - $391,000
2
Beds
1
Bath
2,592
Sq Ft
$131/Sq Ft
Est. Value
About This Home
This home is located at 501 Weaver St Unit 3, Spring Lake, NC 28390 and is currently estimated at $339,985, approximately $131 per square foot. 501 Weaver St Unit 3 is a home located in Cumberland County with nearby schools including Lillian Black Elementary School, Spring Lake Middle, and Pine Forest High.
Ownership History
Date
Name
Owned For
Owner Type
Purchase Details
Closed on
Nov 29, 2023
Sold by
Santos Matthew and Santos Julieta
Bought by
Jessamy Shandel C
Current Estimated Value
Home Financials for this Owner
Home Financials are based on the most recent Mortgage that was taken out on this home.
Original Mortgage
$350,000
Interest Rate
7.5%
Mortgage Type
VA
Purchase Details
Closed on
Nov 1, 2019
Sold by
Grimes Patrick and Grimes Yong
Bought by
Santos Matthew and Herrera Julieta
Home Financials for this Owner
Home Financials are based on the most recent Mortgage that was taken out on this home.
Original Mortgage
$210,000
Interest Rate
3.7%
Purchase Details
Closed on
Aug 21, 2018
Sold by
W C Jones Investment Co
Bought by
Grimes Yong
Create a Home Valuation Report for This Property
The Home Valuation Report is an in-depth analysis detailing your home's value as well as a comparison with similar homes in the area
Home Values in the Area
Average Home Value in this Area
Purchase History
| Date | Buyer | Sale Price | Title Company |
|---|---|---|---|
| Jessamy Shandel C | $350,000 | None Listed On Document | |
| Santos Matthew | $210,000 | Attorney | |
| Grimes Yong | $55,000 | Attorney |
Source: Public Records
Mortgage History
| Date | Status | Borrower | Loan Amount |
|---|---|---|---|
| Open | Jessamy Shandel C | $357,550 | |
| Closed | Jessamy Shandel C | $350,000 | |
| Previous Owner | Santos Matthew | $210,000 |
Source: Public Records
Tax History Compared to Growth
Tax History
| Year | Tax Paid | Tax Assessment Tax Assessment Total Assessment is a certain percentage of the fair market value that is determined by local assessors to be the total taxable value of land and additions on the property. | Land | Improvement |
|---|---|---|---|---|
| 2024 | $2,940 | $77,726 | $9,750 | $67,976 |
| 2023 | $2,940 | $77,726 | $9,750 | $67,976 |
| 2022 | $2,483 | $77,726 | $9,750 | $67,976 |
| 2021 | $2,483 | $77,726 | $9,750 | $67,976 |
| 2019 | $2,361 | $77,300 | $9,750 | $67,550 |
| 2018 | $2,304 | $77,300 | $9,750 | $67,550 |
| 2017 | $2,361 | $77,300 | $9,750 | $67,550 |
| 2016 | $2,282 | $78,979 | $9,750 | $69,229 |
| 2015 | $2,282 | $78,979 | $9,750 | $69,229 |
| 2014 | $2,339 | $78,979 | $9,750 | $69,229 |
Source: Public Records
Map
Nearby Homes