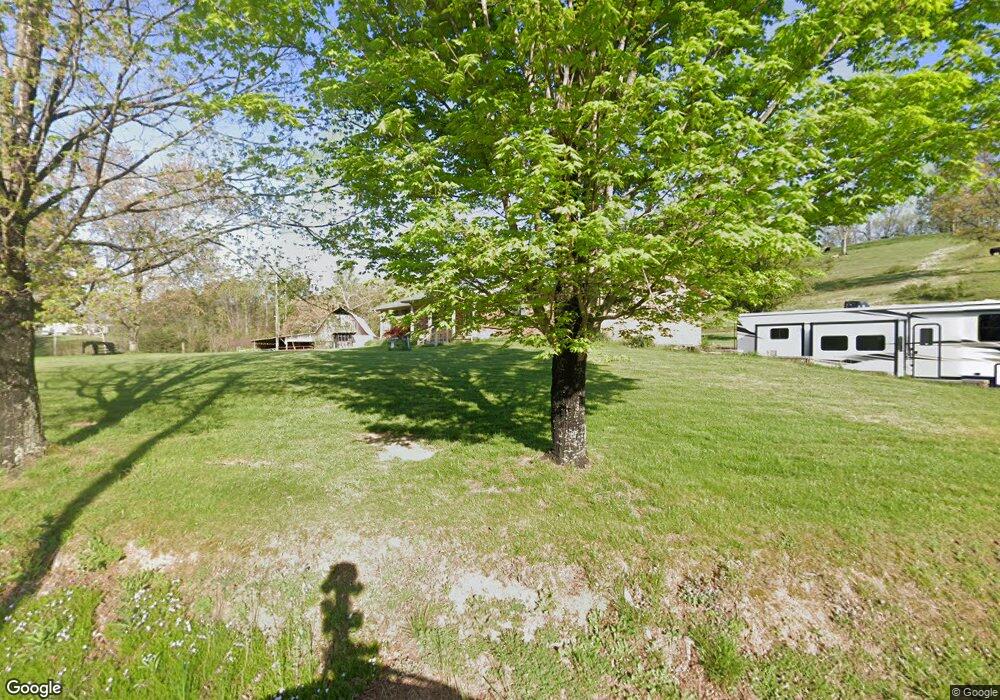
501 Wilson Hale Rd Morristown, TN 37813
Estimated Value: $314,000 - $566,782
--
Bed
2
Baths
1,767
Sq Ft
$237/Sq Ft
Est. Value
About This Home
This home is located at 501 Wilson Hale Rd, Morristown, TN 37813 and is currently estimated at $418,261, approximately $236 per square foot. 501 Wilson Hale Rd is a home located in Hamblen County with nearby schools including Union Heights Elementary School, East Ridge Middle School, and Morristown East High School.
Ownership History
Date
Name
Owned For
Owner Type
Purchase Details
Closed on
Jan 29, 2025
Sold by
Mitchell Kirk James and Lynn Kirk Jerry
Bought by
Kirk Jerry Lynn
Current Estimated Value
Home Financials for this Owner
Home Financials are based on the most recent Mortgage that was taken out on this home.
Original Mortgage
$460,997
Outstanding Balance
$456,734
Interest Rate
6.72%
Mortgage Type
New Conventional
Estimated Equity
-$38,473
Purchase Details
Closed on
Aug 23, 2023
Sold by
Gietema Deborah
Bought by
Mitchell Kirk James and Lynn Kirk Jerry
Purchase Details
Closed on
May 1, 1992
Bought by
Kirk Donald M and Kirk Peggy P
Purchase Details
Closed on
Jan 8, 1992
Purchase Details
Closed on
Jan 7, 1992
Purchase Details
Closed on
Jan 18, 1984
Bought by
Kirk Donald M and Kirk Peggy P
Purchase Details
Closed on
Feb 2, 1983
Purchase Details
Closed on
Mar 22, 1977
Create a Home Valuation Report for This Property
The Home Valuation Report is an in-depth analysis detailing your home's value as well as a comparison with similar homes in the area
Home Values in the Area
Average Home Value in this Area
Purchase History
| Date | Buyer | Sale Price | Title Company |
|---|---|---|---|
| Kirk Jerry Lynn | $450,000 | Lakeway Title Services | |
| Kirk Jerry Lynn | $450,000 | Lakeway Title Services | |
| Mitchell Kirk James | -- | None Listed On Document | |
| Gietema Deborah | -- | None Listed On Document | |
| Kirk Donald M | $10,000 | -- | |
| -- | $7,500 | -- | |
| -- | -- | -- | |
| Kirk Donald M | -- | -- | |
| -- | -- | -- | |
| -- | -- | -- |
Source: Public Records
Mortgage History
| Date | Status | Borrower | Loan Amount |
|---|---|---|---|
| Open | Kirk Jerry Lynn | $460,997 | |
| Closed | Kirk Jerry Lynn | $460,997 |
Source: Public Records
Tax History Compared to Growth
Tax History
| Year | Tax Paid | Tax Assessment Tax Assessment Total Assessment is a certain percentage of the fair market value that is determined by local assessors to be the total taxable value of land and additions on the property. | Land | Improvement |
|---|---|---|---|---|
| 2024 | $1,211 | $61,450 | $26,475 | $34,975 |
| 2023 | $1,211 | $61,450 | $0 | $0 |
| 2022 | $1,211 | $61,450 | $26,475 | $34,975 |
| 2021 | $1,211 | $61,450 | $26,475 | $34,975 |
| 2020 | $1,211 | $61,450 | $26,475 | $34,975 |
| 2019 | $1,114 | $52,300 | $21,450 | $30,850 |
| 2018 | $1,114 | $52,300 | $21,450 | $30,850 |
| 2017 | $1,114 | $52,300 | $21,450 | $30,850 |
| 2016 | $1,041 | $52,300 | $21,450 | $30,850 |
| 2015 | $968 | $52,300 | $21,450 | $30,850 |
| 2014 | -- | $52,300 | $21,450 | $30,850 |
| 2013 | -- | $54,875 | $0 | $0 |
Source: Public Records
Map
Nearby Homes
- 1500 S Davy Crockett Pkwy
- 1051 Wilson Hale Rd
- 2945 Enka Hwy
- 1256 Arden Ln
- 848 Spencer Hale Rd
- 453 Statem Gap Rd
- 305-365 Barkley Landing Dr
- 828 Overlook Dr
- 1160 Statem Gap Rd
- 1621 S Cumberland St
- 423 Hayter Dr
- 108 Annie Ln
- 109 Annie Ln
- Lot 101 Geneva Ln
- Lot 99 Geneva Ln
- 98 Geneva Ln
- Lot 100 Geneva Ln
- 1418 Mae Collins Rd
- 4207 Clyde Thomas Rd
- 000 Bacon Ln
- 3033 S Davy Crockett Pkwy
- 3562 David St John Rd
- 0 S Davy Crockett Prky Unit 576884
- 413 Wilson Hale Rd
- 741 Wilson Hale Rd
- 0 Davy Crockett Parkway Hwy25e Unit 1184055
- 686 Wilson Hale Rd
- 762 Wilson Hale Rd
- 762 Wilson Hale Rd
- 601 Wilson Hale Rd
- 3062 Springvale McClister Unit 1
- 3062 Springvale McClister
- 754 Wilson Hale Rd
- 3028 S Davy Crockett Pkwy
- 3887 S Davy Crockett Pkwy
- 3020 S Davy Crockett Pkwy
- 3941 S Davy Crockett Pkwy
- 3012 S Davy Crockett Pkwy
- 3041 Newport Hwy
- 3881 S Davy Crockett Pkwy