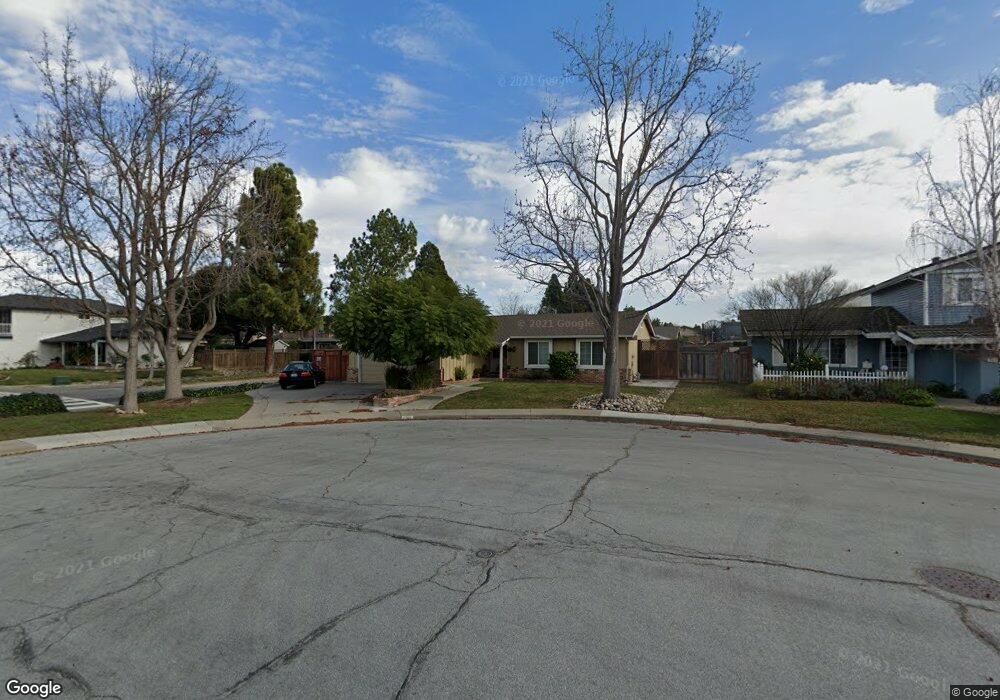
5010 Dorking Ct Newark, CA 94560
Estimated Value: $1,513,000 - $1,600,618
3
Beds
2
Baths
1,610
Sq Ft
$975/Sq Ft
Est. Value
About This Home
This home is located at 5010 Dorking Ct, Newark, CA 94560 and is currently estimated at $1,569,155, approximately $974 per square foot. 5010 Dorking Ct is a home located in Alameda County with nearby schools including John F. Kennedy Elementary School, Newark Junior High School, and Newark Memorial High School.
Ownership History
Date
Name
Owned For
Owner Type
Purchase Details
Closed on
Apr 18, 2015
Sold by
Santos Jose H and Santos Cristina R
Bought by
Jose H & Cristina R Santos Family Trust
Current Estimated Value
Purchase Details
Closed on
May 21, 2012
Sold by
Lavarre Patrick E and Lavarre Penny
Bought by
Santos Jose H and Santos Cristina R
Home Financials for this Owner
Home Financials are based on the most recent Mortgage that was taken out on this home.
Original Mortgage
$376,000
Outstanding Balance
$259,900
Interest Rate
3.85%
Mortgage Type
New Conventional
Estimated Equity
$1,309,255
Purchase Details
Closed on
Mar 7, 2005
Sold by
Hutchens Brett and Hutchens Fatima A
Bought by
Lavarre Patrick E and Lavarre Penny
Home Financials for this Owner
Home Financials are based on the most recent Mortgage that was taken out on this home.
Original Mortgage
$580,000
Interest Rate
5.62%
Mortgage Type
Purchase Money Mortgage
Purchase Details
Closed on
Jan 19, 2005
Sold by
Hutchens Brett and Hutchens Fatima A
Bought by
Hutchens Brett and Hutchens Fatima A
Home Financials for this Owner
Home Financials are based on the most recent Mortgage that was taken out on this home.
Original Mortgage
$580,000
Interest Rate
5.62%
Mortgage Type
Purchase Money Mortgage
Purchase Details
Closed on
Jun 17, 2002
Sold by
Carion Debbie K
Bought by
Hutchens Brett and Diaz Fatima A
Home Financials for this Owner
Home Financials are based on the most recent Mortgage that was taken out on this home.
Original Mortgage
$424,000
Interest Rate
5.62%
Purchase Details
Closed on
May 16, 2002
Sold by
Carion Debbie K
Bought by
Carion Debbie K and Carion Chris
Home Financials for this Owner
Home Financials are based on the most recent Mortgage that was taken out on this home.
Original Mortgage
$424,000
Interest Rate
5.62%
Purchase Details
Closed on
Jul 16, 2001
Sold by
Carion Chris and Carion Chris B
Bought by
Carion Debbie K
Purchase Details
Closed on
Sep 24, 1997
Sold by
Ennis C E L and Ennis Donna L
Bought by
Carion Chris and Carion Debbie K
Home Financials for this Owner
Home Financials are based on the most recent Mortgage that was taken out on this home.
Original Mortgage
$242,400
Interest Rate
7.44%
Purchase Details
Closed on
Sep 26, 1994
Sold by
Ennis Charles E and Ennis Donna
Bought by
Ennis Charles E and Ennis Donna L
Create a Home Valuation Report for This Property
The Home Valuation Report is an in-depth analysis detailing your home's value as well as a comparison with similar homes in the area
Home Values in the Area
Average Home Value in this Area
Purchase History
| Date | Buyer | Sale Price | Title Company |
|---|---|---|---|
| Jose H & Cristina R Santos Family Trust | -- | None Available | |
| Santos Jose H | $470,000 | Chicago Title Company | |
| Lavarre Patrick E | $725,000 | Alliance Title | |
| Hutchens Brett | -- | New Century Title Company | |
| Hutchens Brett | $530,000 | Chicago Title Co | |
| Carion Debbie K | $150,000 | New Century Title Company | |
| Carion Debbie K | -- | -- | |
| Carion Chris | $30,272 | North American Title Co | |
| Ennis Charles E | -- | -- |
Source: Public Records
Mortgage History
| Date | Status | Borrower | Loan Amount |
|---|---|---|---|
| Open | Santos Jose H | $376,000 | |
| Previous Owner | Lavarre Patrick E | $580,000 | |
| Previous Owner | Hutchens Brett | $465,000 | |
| Previous Owner | Hutchens Brett | $424,000 | |
| Previous Owner | Carion Debbie K | $150,000 | |
| Previous Owner | Carion Chris | $242,400 | |
| Closed | Carion Chris | $45,400 | |
| Closed | Hutchens Brett | $53,000 | |
| Closed | Lavarre Patrick E | $108,750 |
Source: Public Records
Tax History Compared to Growth
Tax History
| Year | Tax Paid | Tax Assessment Tax Assessment Total Assessment is a certain percentage of the fair market value that is determined by local assessors to be the total taxable value of land and additions on the property. | Land | Improvement |
|---|---|---|---|---|
| 2025 | $7,377 | $583,314 | $177,094 | $413,220 |
| 2024 | $7,377 | $571,743 | $173,623 | $405,120 |
| 2023 | $7,173 | $567,397 | $170,219 | $397,178 |
| 2022 | $7,073 | $549,272 | $166,881 | $389,391 |
| 2021 | $6,897 | $538,368 | $163,610 | $381,758 |
| 2020 | $6,791 | $539,780 | $161,934 | $377,846 |
| 2019 | $6,694 | $529,200 | $158,760 | $370,440 |
| 2018 | $6,593 | $518,827 | $155,648 | $363,179 |
| 2017 | $6,425 | $508,657 | $152,597 | $356,060 |
| 2016 | $6,356 | $498,683 | $149,605 | $349,078 |
| 2015 | $6,334 | $491,196 | $147,359 | $343,837 |
| 2014 | -- | $481,575 | $144,472 | $337,103 |
Source: Public Records
Map
Nearby Homes
- 5093 Dorking Ct
- 4987 Winchester Place
- 35605 Scarborough Dr
- 4955 Swindon Place
- 35936 Magellan Dr
- 35856 Adobe Dr
- 36139 San Pedro Dr
- 36202 Worthing Dr
- 5139 Dryden Ct
- 35978 Magellan Dr
- 4626 Alhambra Dr
- 35345 Cabral Dr
- 35220 Cornwall Place
- 36288 Saxon Ct
- 5303 Stirling Ct
- 35377 Cabrillo Dr
- 36347 Magellan Dr
- 36304 Magellan Dr
- 36521 Cabrillo Dr
- 36686 Charles St
- 5007 Wembley Ct
- 5015 Wembley Ct
- 5048 Dorking Ct
- 4990 Farnham Dr
- 5009 Dorking Ct
- 5043 Wembley Ct
- 4991 Norwich Place
- 5027 Dorking Ct
- 5074 Dorking Ct
- 4976 Farnham Dr
- 5041 Dorking Ct
- 4989 Farnham Dr
- 5061 Wembley Ct
- 4967 Norwich Place
- 5004 Wembley Ct
- 5065 Dorking Ct
- 5016 Wembley Ct
- 5006 Tottenham Ct
- 5088 Dorking Ct
- 4971 Farnham Dr