Estimated Value: $177,000 - $202,000
3
Beds
2
Baths
1,317
Sq Ft
$142/Sq Ft
Est. Value
About This Home
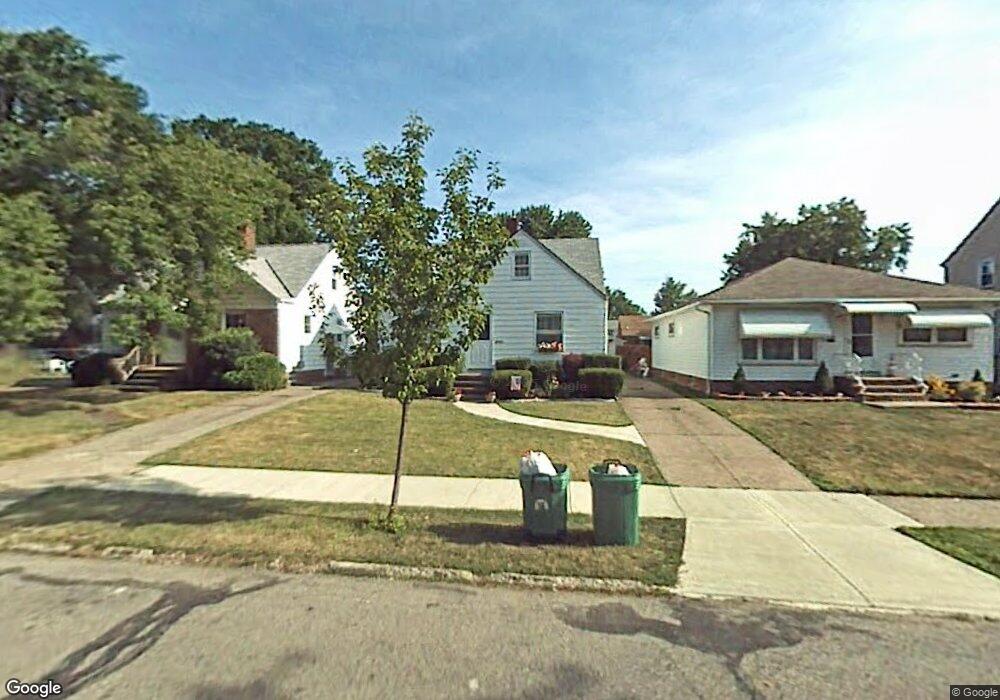
This home is located at 5010 Pershing Ave, Parma, OH 44134 and is currently estimated at $186,991, approximately $141 per square foot. 5010 Pershing Ave is a home located in Cuyahoga County with nearby schools including Thoreau Park Elementary School, Shiloh Middle School, and Normandy High School.
Ownership History
Date
Name
Owned For
Owner Type
Purchase Details
Closed on
Apr 17, 1999
Sold by
Maher James T and Maher Debra A
Bought by
Wollmann Michael N and Bryan Wollmann Kathleen M
Current Estimated Value
Home Financials for this Owner
Home Financials are based on the most recent Mortgage that was taken out on this home.
Original Mortgage
$75,200
Interest Rate
6.73%
Purchase Details
Closed on
Aug 31, 1994
Sold by
Sisters Of St Francis
Bought by
Primary Health Systems
Home Financials for this Owner
Home Financials are based on the most recent Mortgage that was taken out on this home.
Original Mortgage
$7,500,000
Interest Rate
8.59%
Mortgage Type
New Conventional
Purchase Details
Closed on
May 19, 1989
Sold by
Zak Deborah J
Bought by
Maher James T
Purchase Details
Closed on
May 20, 1983
Sold by
Zak John D
Bought by
Zak Deborah J
Purchase Details
Closed on
Nov 9, 1982
Sold by
Zakrajsek Edward A
Bought by
Zak John D
Purchase Details
Closed on
Jan 1, 1975
Bought by
Zakrajsek Edward A
Create a Home Valuation Report for This Property
The Home Valuation Report is an in-depth analysis detailing your home's value as well as a comparison with similar homes in the area
Home Values in the Area
Average Home Value in this Area
Purchase History
| Date | Buyer | Sale Price | Title Company |
|---|---|---|---|
| Wollmann Michael N | $94,000 | Guardian Title | |
| Primary Health Systems | $2,300,000 | -- | |
| Maher James T | $64,100 | -- | |
| Zak Deborah J | $25,000 | -- | |
| Zak John D | -- | -- | |
| Zakrajsek Edward A | -- | -- |
Source: Public Records
Mortgage History
| Date | Status | Borrower | Loan Amount |
|---|---|---|---|
| Closed | Wollmann Michael N | $75,200 | |
| Closed | Primary Health Systems | $7,500,000 |
Source: Public Records
Tax History
| Year | Tax Paid | Tax Assessment Tax Assessment Total Assessment is a certain percentage of the fair market value that is determined by local assessors to be the total taxable value of land and additions on the property. | Land | Improvement |
|---|---|---|---|---|
| 2024 | $3,500 | $56,175 | $11,060 | $45,115 |
| 2023 | $3,049 | $41,900 | $9,100 | $32,800 |
| 2022 | $3,020 | $41,895 | $9,100 | $32,795 |
| 2021 | $3,109 | $41,900 | $9,100 | $32,800 |
| 2020 | $2,723 | $32,240 | $7,000 | $25,240 |
| 2019 | $2,608 | $92,100 | $20,000 | $72,100 |
| 2018 | $2,624 | $32,240 | $7,000 | $25,240 |
| 2017 | $2,375 | $27,720 | $5,250 | $22,470 |
| 2016 | $2,360 | $27,720 | $5,250 | $22,470 |
| 2015 | $2,249 | $27,720 | $5,250 | $22,470 |
| 2014 | $2,249 | $28,290 | $5,360 | $22,930 |
Source: Public Records
Map
Nearby Homes
- 5212 Wood Ave
- 5107 Krueger Ave
- 4410 Wood Ave
- 4607 Lincoln Ave
- 4312 Kenmore Ave
- 4419 Lincoln Ave
- 4101 Pershing Ave
- 4717 Snow Rd
- 4000 Pershing Ave
- 5615 Snow Rd
- 4323 Russell Ave
- 5615 Luelda Ave
- 6506 Orchard Ave
- 5279 W 50th St
- 4514 Tuxedo Ave
- 4011 Liggett Dr
- 5268 W 46th St
- 0 Forest Ave Unit 5178492
- 3810 Lincoln Ave
- 4007 Tuxedo Ave
- 5102 Pershing Ave
- 5006 Pershing Ave
- 5106 Pershing Ave
- 5002 Pershing Ave
- 5110 Pershing Ave
- 5000 Pershing Ave
- 5011 Torrington Ave
- 5015 Torrington Ave
- 5114 Pershing Ave
- 5005 Torrington Ave
- 4922 Pershing Ave
- 5103 Torrington Ave
- 5001 Torrington Ave
- 5107 Torrington Ave
- 5011 Pershing Ave
- 5103 Pershing Ave
- 5007 Pershing Ave
- 5202 Pershing Ave
- 4918 Pershing Ave
- 5107 Pershing Ave
Your Personal Tour Guide
Ask me questions while you tour the home.