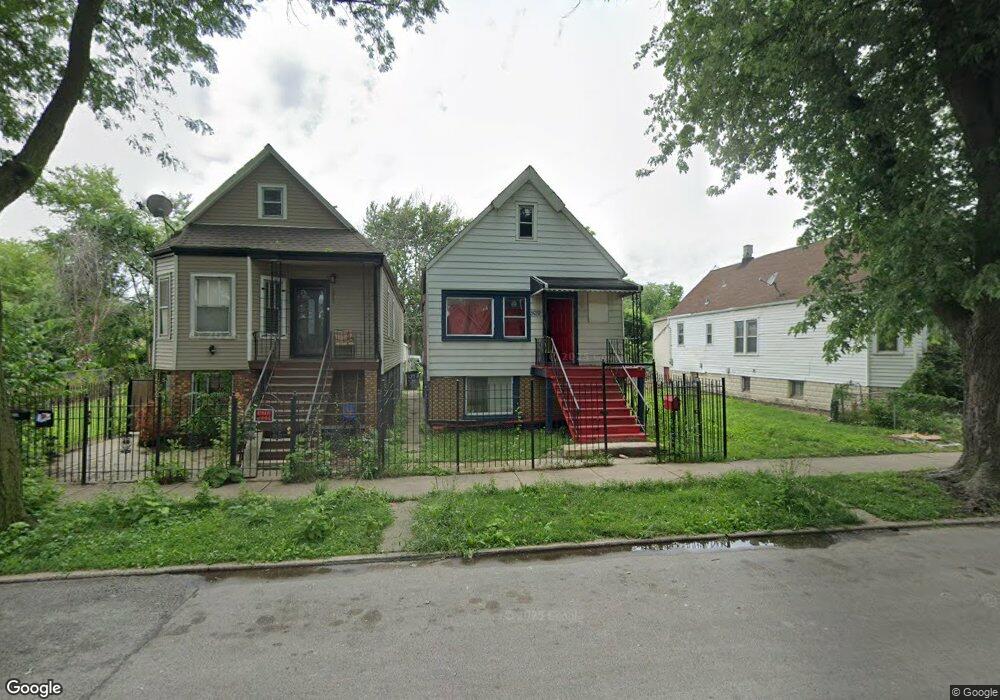
5010 S Ada St Chicago, IL 60609
Back of the Yards NeighborhoodEstimated Value: $25,000 - $151,000
3
Beds
1
Bath
900
Sq Ft
$122/Sq Ft
Est. Value
About This Home
This home is located at 5010 S Ada St, Chicago, IL 60609 and is currently estimated at $109,493, approximately $121 per square foot. 5010 S Ada St is a home located in Cook County with nearby schools including Libby Elementary School.
Ownership History
Date
Name
Owned For
Owner Type
Purchase Details
Closed on
Jan 22, 2014
Sold by
Castlerock Reo 1 Llc
Bought by
One Pine Viii Llc
Current Estimated Value
Purchase Details
Closed on
Aug 12, 2010
Sold by
Castlerock Reo Llc
Bought by
Slusher Adriana and Slusher Vonetta
Home Financials for this Owner
Home Financials are based on the most recent Mortgage that was taken out on this home.
Original Mortgage
$22,500
Interest Rate
4.02%
Purchase Details
Closed on
Jul 21, 2010
Sold by
Deutsche Bank National Trust Company
Bought by
Castlerock Reo 1 Llc
Home Financials for this Owner
Home Financials are based on the most recent Mortgage that was taken out on this home.
Original Mortgage
$22,500
Interest Rate
4.02%
Purchase Details
Closed on
Mar 18, 2010
Sold by
Turner
Bought by
Deutsche Bank National Trust Company
Purchase Details
Closed on
Apr 8, 2003
Sold by
Bank One Na
Bought by
Turner Albert and Turner Betty J
Purchase Details
Closed on
Feb 26, 2003
Sold by
Smith Burnett P
Bought by
Bank One Na
Create a Home Valuation Report for This Property
The Home Valuation Report is an in-depth analysis detailing your home's value as well as a comparison with similar homes in the area
Home Values in the Area
Average Home Value in this Area
Purchase History
| Date | Buyer | Sale Price | Title Company |
|---|---|---|---|
| One Pine Viii Llc | -- | None Available | |
| Slusher Adriana | $24,000 | None Available | |
| Castlerock Reo 1 Llc | -- | None Available | |
| Deutsche Bank National Trust Company | -- | None Available | |
| Turner Albert | $26,500 | -- | |
| Bank One Na | -- | -- |
Source: Public Records
Mortgage History
| Date | Status | Borrower | Loan Amount |
|---|---|---|---|
| Previous Owner | Slusher Adriana | $22,500 |
Source: Public Records
Tax History Compared to Growth
Tax History
| Year | Tax Paid | Tax Assessment Tax Assessment Total Assessment is a certain percentage of the fair market value that is determined by local assessors to be the total taxable value of land and additions on the property. | Land | Improvement |
|---|---|---|---|---|
| 2024 | $738 | $5,601 | $938 | $4,663 |
| 2023 | $720 | $3,500 | $2,031 | $1,469 |
| 2022 | $720 | $3,500 | $2,031 | $1,469 |
| 2021 | $704 | $3,499 | $2,031 | $1,468 |
| 2020 | $1,156 | $5,191 | $2,031 | $3,160 |
| 2019 | $1,172 | $5,833 | $2,031 | $3,802 |
| 2018 | $1,152 | $5,833 | $2,031 | $3,802 |
| 2017 | $1,932 | $8,974 | $1,875 | $7,099 |
| 2016 | $1,797 | $8,974 | $1,875 | $7,099 |
| 2015 | $1,644 | $8,974 | $1,875 | $7,099 |
| 2014 | $1,419 | $7,648 | $1,718 | $5,930 |
| 2013 | $1,391 | $7,648 | $1,718 | $5,930 |
Source: Public Records
Map
Nearby Homes
- 5017 S Ada St
- 1343 W 49th Place
- 5013 S Bishop St
- 5030 S Loomis Blvd
- 5034 S Loomis Blvd
- 5033 S Throop St
- 1248 W 51st St
- 1220 W 51st St
- 5028 S Throop St
- 911 W 51st St
- 5042 S Laflin St
- 1208 W 51st St
- 4942 S Racine Ave
- 737 W 50th St
- 735 W 50th St
- 4845 S Throop St
- 5125 S Elizabeth St
- 5029 S Racine Ave
- 4800 S Throop St
- 4838 S Bishop St
- 5012 S Ada St
- 5006 S Ada St
- 5014 S Ada St
- 5004 S Ada St
- 5018 S Ada St
- 5013 S Loomis Blvd
- 5017 S Loomis Blvd
- 5007 S Loomis Blvd
- 5023 S Loomis Blvd
- 5021 S Loomis Blvd
- 5011 S Ada St
- 5013 S Ada St
- 5021 S Loomis Blvd
- 5003 S Loomis Blvd
- 5026 S Ada St
- 5001 S Loomis Blvd
- 5019 S Ada St
- 5036 S Ada St
- 5021 S Ada St
- 5023 S Ada St