
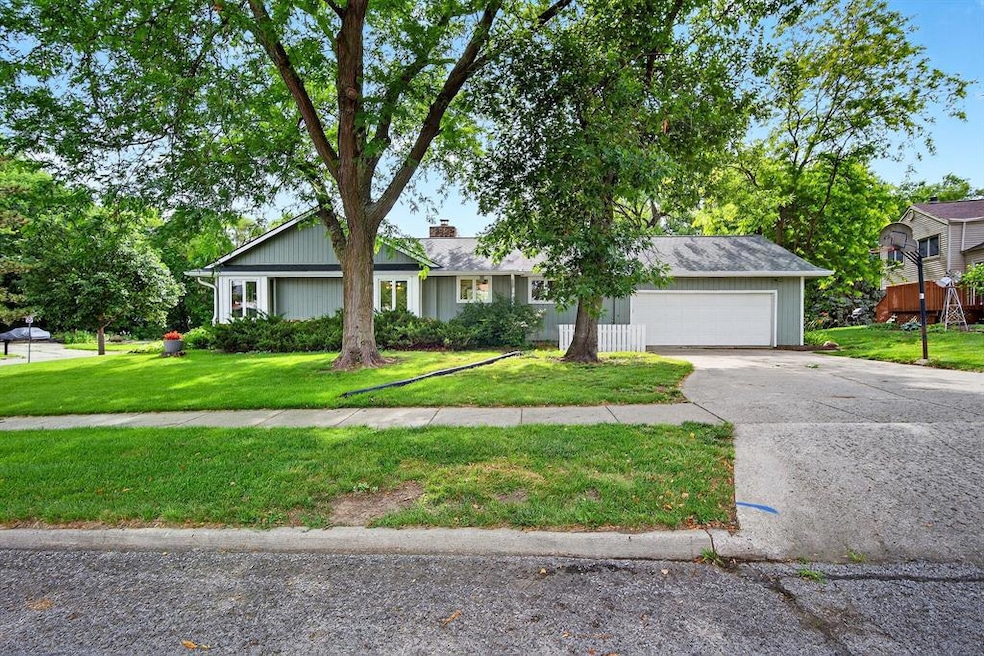


5010 Twana Dr Des Moines, IA 50310
Meredith Neighborhood
4
Beds
3.5
Baths
2,152
Sq Ft
0.45
Acres
Highlights
- Ranch Style House
- No HOA
- Forced Air Heating and Cooling System
- Johnston Middle School Rated A-
- Outdoor Storage
- Family Room Downstairs
About This Home
As of August 2025Welcome home to this spacious ranch in the Johnston School District with a beautifully landscaped yard that is nearly 1/2 an acre! Inside, enjoy two large living areas separated by a stunning double-sided stone fireplace, a dining room, and a generous kitchen. A half bath and laundry room are conveniently located nearby. The main floor includes two bedrooms, one a primary suite with a full bathroom attached and a second bedroom located near a 3/4 bath.
The finished basement adds two more large bedrooms, another 3⁄4 bath, a family room, bonus room, storage, and a workshop with stair access to the garage. Outside features a fenced yard, oversized 24'x28' garage, circle drive, garden shed, and 10'x18' shed with garage doors on both ends. Some of the updates include a newer roof, updated windows, sump pump, and HVAC.
This home offers so much space, character, and thoughtful updates - don't miss your chance!
Home Details
Home Type
- Single Family
Est. Annual Taxes
- $7,424
Year Built
- Built in 1978
Lot Details
- 0.45 Acre Lot
- Property is Fully Fenced
- Property is zoned N2B
Home Design
- Ranch Style House
- Block Foundation
- Cement Board or Planked
Interior Spaces
- 2,152 Sq Ft Home
- Wood Burning Fireplace
- Family Room Downstairs
- Dining Area
- Finished Basement
Kitchen
- Stove
- Microwave
- Dishwasher
Bedrooms and Bathrooms
- 4 Bedrooms | 2 Main Level Bedrooms
Laundry
- Laundry on main level
- Dryer
- Washer
Parking
- 2 Car Attached Garage
- Driveway
Additional Features
- Outdoor Storage
- Forced Air Heating and Cooling System
Community Details
- No Home Owners Association
Listing and Financial Details
- Assessor Parcel Number 10012844617001
Ownership History
Date
Name
Owned For
Owner Type
Purchase Details
Closed on
Oct 6, 2011
Sold by
Coulson Vicki
Bought by
Purdy John and Purdy Darlys
Purchase Details
Closed on
Aug 5, 2003
Sold by
Poetzl Steven L and Poetzl Carolyn E
Bought by
Purdy John and Purdy Darlys
Home Financials for this Owner
Home Financials are based on the most recent Mortgage that was taken out on this home.
Original Mortgage
$153,000
Interest Rate
5.31%
Mortgage Type
Purchase Money Mortgage
Similar Homes in Des Moines, IA
Create a Home Valuation Report for This Property
The Home Valuation Report is an in-depth analysis detailing your home's value as well as a comparison with similar homes in the area
Home Values in the Area
Average Home Value in this Area
Purchase History
| Date | Type | Sale Price | Title Company |
|---|---|---|---|
| Quit Claim Deed | $8,500 | None Available | |
| Warranty Deed | $179,500 | -- |
Source: Public Records
Mortgage History
| Date | Status | Loan Amount | Loan Type |
|---|---|---|---|
| Open | $196,000 | Credit Line Revolving | |
| Closed | $185,000 | New Conventional | |
| Closed | $178,000 | New Conventional | |
| Previous Owner | $188,746 | FHA | |
| Previous Owner | $35,000 | Unknown | |
| Previous Owner | $153,000 | Purchase Money Mortgage |
Source: Public Records
Property History
| Date | Event | Price | Change | Sq Ft Price |
|---|---|---|---|---|
| 08/28/2025 08/28/25 | Sold | $375,000 | 0.0% | $174 / Sq Ft |
| 07/31/2025 07/31/25 | Pending | -- | -- | -- |
| 07/23/2025 07/23/25 | Price Changed | $375,000 | -6.3% | $174 / Sq Ft |
| 06/18/2025 06/18/25 | For Sale | $400,000 | -- | $186 / Sq Ft |
Source: Des Moines Area Association of REALTORS®
Tax History Compared to Growth
Tax History
| Year | Tax Paid | Tax Assessment Tax Assessment Total Assessment is a certain percentage of the fair market value that is determined by local assessors to be the total taxable value of land and additions on the property. | Land | Improvement |
|---|---|---|---|---|
| 2024 | $6,626 | $353,600 | $58,300 | $295,300 |
| 2023 | $6,512 | $353,600 | $58,300 | $295,300 |
| 2022 | $6,512 | $299,700 | $51,900 | $247,800 |
| 2021 | $6,842 | $299,700 | $51,900 | $247,800 |
| 2020 | $6,842 | $277,600 | $48,500 | $229,100 |
| 2019 | $6,482 | $277,600 | $48,500 | $229,100 |
| 2018 | $6,412 | $251,000 | $42,500 | $208,500 |
| 2017 | $6,006 | $251,000 | $42,500 | $208,500 |
| 2016 | $5,726 | $231,700 | $38,600 | $193,100 |
Source: Public Records
Agents Affiliated with this Home
-
Rachelle Cochran
R
Seller's Agent in 2025
Rachelle Cochran
EXP Realty, LLC
(515) 991-8518
3 in this area
125 Total Sales
-
Michelle Ternes
Seller Co-Listing Agent in 2025
Michelle Ternes
EXP Realty, LLC
2 in this area
105 Total Sales
-
Patrick Pena
P
Buyer's Agent in 2025
Patrick Pena
Realty ONE Group Impact
(515) 822-6866
3 in this area
68 Total Sales
Map
Source: Des Moines Area Association of REALTORS®
MLS Number: 720490
APN: 100-12844617001
Disclaimer: Certain information contained herein is derived from information provided by parties other than Homes.com. All information provided is deemed reliable, but is not guaranteed to be accurate and should be independently verified.
![]() IDX information is provided exclusively for personal, non-commercial use, and may not be used for any purpose other than to identify prospective properties consumers may be interested in purchasing. Information is deemed reliable but not guaranteed.
IDX information is provided exclusively for personal, non-commercial use, and may not be used for any purpose other than to identify prospective properties consumers may be interested in purchasing. Information is deemed reliable but not guaranteed.
Nearby Homes
- 5200 Twana Dr
- 5118 Bel Aire Rd Unit 5118
- 4505 51st St
- 4135 51st St
- 4542 51st St
- 4552 50th St
- 5238 Meredith Dr
- 4707 Palm Ave
- 4131 55th St
- 4149 56th St
- 3940 51st St
- 4020 54th St
- 4425 Aurora Ave
- 3944 53rd St
- 4401 Twana Dr
- 4130 Beaver Ave
- 5567 Meredith Dr Unit 3A
- 3912 53rd St
- 3921 48th St
- 5583 Meredith Dr Unit 5C