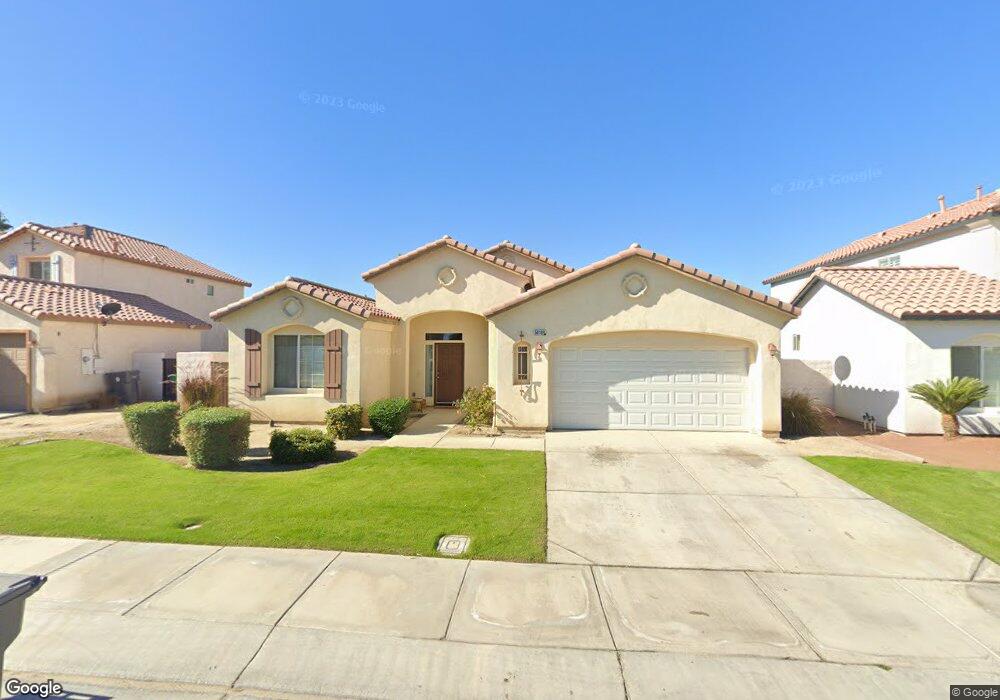
50109 San Solano Rd Coachella, CA 92236
Estimated Value: $454,000 - $524,273
4
Beds
4
Baths
1,912
Sq Ft
$257/Sq Ft
Est. Value
About This Home
This home is located at 50109 San Solano Rd, Coachella, CA 92236 and is currently estimated at $491,068, approximately $256 per square foot. 50109 San Solano Rd is a home located in Riverside County with nearby schools including Coral Mountain Academy, Cahuilla Desert Academy Junior High, and Coachella Valley High School.
Ownership History
Date
Name
Owned For
Owner Type
Purchase Details
Closed on
Sep 6, 2024
Sold by
Eastman Bill and Eastman Lisa
Bought by
Montes Arnulfo Ochoa and Reyes Claudia
Current Estimated Value
Home Financials for this Owner
Home Financials are based on the most recent Mortgage that was taken out on this home.
Original Mortgage
$469,342
Interest Rate
6.72%
Mortgage Type
FHA
Purchase Details
Closed on
Jun 9, 2011
Sold by
The Bank Of New York Mellon
Bought by
Eastman Bill and Eastman Lisa
Purchase Details
Closed on
Mar 7, 2011
Sold by
Silva Chuck A and Silva Sally J
Bought by
The Bank Of New York Mellon and The Bank Of New York
Purchase Details
Closed on
Aug 31, 2005
Sold by
Gentry Capital Partners Inc
Bought by
Silva Chuck A and Silva Sally J
Home Financials for this Owner
Home Financials are based on the most recent Mortgage that was taken out on this home.
Original Mortgage
$294,636
Interest Rate
2.37%
Mortgage Type
Negative Amortization
Create a Home Valuation Report for This Property
The Home Valuation Report is an in-depth analysis detailing your home's value as well as a comparison with similar homes in the area
Home Values in the Area
Average Home Value in this Area
Purchase History
| Date | Buyer | Sale Price | Title Company |
|---|---|---|---|
| Montes Arnulfo Ochoa | $478,000 | Chicago Title | |
| Eastman Bill | $137,000 | Landsafe Title Simi Valley | |
| The Bank Of New York Mellon | $130,500 | Landsafe Default Inc | |
| Silva Chuck A | $368,500 | Stewart Title Riverside |
Source: Public Records
Mortgage History
| Date | Status | Borrower | Loan Amount |
|---|---|---|---|
| Open | Montes Arnulfo Ochoa | $16,730 | |
| Previous Owner | Montes Arnulfo Ochoa | $469,342 | |
| Previous Owner | Silva Chuck A | $294,636 |
Source: Public Records
Tax History
| Year | Tax Paid | Tax Assessment Tax Assessment Total Assessment is a certain percentage of the fair market value that is determined by local assessors to be the total taxable value of land and additions on the property. | Land | Improvement |
|---|---|---|---|---|
| 2025 | $4,048 | $478,000 | $119,500 | $358,500 |
| 2023 | $4,048 | $168,687 | $41,858 | $126,829 |
| 2022 | $3,850 | $165,381 | $41,038 | $124,343 |
| 2021 | $3,735 | $162,139 | $40,234 | $121,905 |
| 2020 | $3,621 | $160,478 | $39,822 | $120,656 |
| 2019 | $3,142 | $157,333 | $39,042 | $118,291 |
| 2018 | $3,439 | $154,249 | $38,278 | $115,971 |
| 2017 | $3,363 | $151,226 | $37,528 | $113,698 |
| 2016 | $3,241 | $148,262 | $36,793 | $111,469 |
| 2015 | $3,137 | $146,038 | $36,242 | $109,796 |
| 2014 | $2,611 | $143,180 | $35,533 | $107,647 |
Source: Public Records
Map
Nearby Homes
- 50007 Calle Frontera
- 50157 Calle Tolosa
- 0 Calhoun St Unit 219117908DA
- 0 Ave 50 & Calhoun St Unit 219083198
- 50241 Camino El Faro
- 83644 Jaderock Rd
- 83680 Jaderock Rd
- 83697 Shadowrock Dr
- 83765 Pyramid Ranch Dr
- 83775 Pyramid Ranch Dr
- 83808 Avenida Verano
- 83766 Pyramid Ranch Dr
- 83778 Pyramid Ranch Dr
- 83777 Corte Estivo
- 83797 Pyramid Ranch Dr
- 83788 Pyramid Ranch Dr
- 83834 Pyramid Ranch Dr
- 83796 Moreno St
- 83207 Verio Way
- 49459 Meadowlark Place
- 50083 San Solano Rd
- 50135 San Solano Rd
- 50108 San Capistrano Dr
- 50082 San Capistrano Dr
- 50134 San Capistrano Dr
- 50057 San Solano Rd
- 50161 San Solano Rd
- 50056 San Capistrano Dr
- 50160 San Capistrano Dr
- 50110 San Solano Rd
- 50136 San Solano Rd
- 50187 San Solano Rd
- 50031 San Solano Rd
- 50084 San Solano Rd
- 50162 San Solano Rd
- 50186 San Capistrano Dr
- 50030 San Capistrano Dr
- 50058 San Solano Rd
- 50188 San Solano Rd
- 50213 San Solano Rd
Your Personal Tour Guide
Ask me questions while you tour the home.