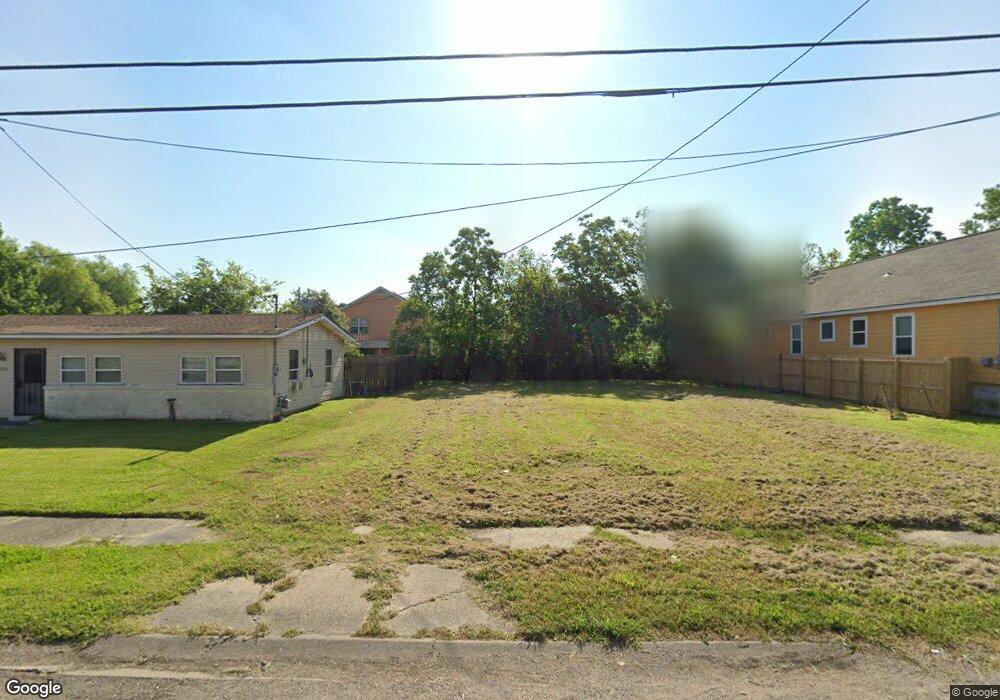
5011 Piety Dr New Orleans, LA 70126
Pontchartrain Park NeighborhoodEstimated Value: $262,000 - $292,000
--
Bed
--
Bath
--
Sq Ft
6,142
Sq Ft Lot
About This Home
This home is located at 5011 Piety Dr, New Orleans, LA 70126 and is currently estimated at $272,373. 5011 Piety Dr is a home located in Orleans Parish with nearby schools including Audubon Gentilly, Mary Bethune Elementary School, and Hynes Parkview.
Ownership History
Date
Name
Owned For
Owner Type
Purchase Details
Closed on
Feb 6, 2022
Sold by
Muyskens Morgan M and Muyskens Lee M
Bought by
Muyskens Morgan and Scafidi Lee M
Current Estimated Value
Purchase Details
Closed on
Mar 25, 2020
Sold by
T & T Real Estate Development Llc
Bought by
Muyskens Morgan and Scafidi Lee M
Home Financials for this Owner
Home Financials are based on the most recent Mortgage that was taken out on this home.
Original Mortgage
$237,500
Interest Rate
3.4%
Mortgage Type
New Conventional
Purchase Details
Closed on
Aug 12, 2019
Sold by
Rmw Properties Llc
Bought by
T & T Real Estate Development Llc
Home Financials for this Owner
Home Financials are based on the most recent Mortgage that was taken out on this home.
Original Mortgage
$177,800
Interest Rate
3.73%
Mortgage Type
Future Advance Clause Open End Mortgage
Purchase Details
Closed on
Mar 27, 2015
Sold by
Anderson Mary A L and Nelon Claudia R L
Bought by
Rmw Properties Llc
Create a Home Valuation Report for This Property
The Home Valuation Report is an in-depth analysis detailing your home's value as well as a comparison with similar homes in the area
Home Values in the Area
Average Home Value in this Area
Purchase History
| Date | Buyer | Sale Price | Title Company |
|---|---|---|---|
| Muyskens Morgan | -- | Advantage Title Company | |
| Muyskens Morgan | $250,000 | Crescent Title Llc | |
| T & T Real Estate Development Llc | $40,500 | Crescent Title Llc | |
| Rmw Properties Llc | $5,500 | -- |
Source: Public Records
Mortgage History
| Date | Status | Borrower | Loan Amount |
|---|---|---|---|
| Previous Owner | Muyskens Morgan | $237,500 | |
| Previous Owner | T & T Real Estate Development Llc | $177,800 |
Source: Public Records
Tax History Compared to Growth
Tax History
| Year | Tax Paid | Tax Assessment Tax Assessment Total Assessment is a certain percentage of the fair market value that is determined by local assessors to be the total taxable value of land and additions on the property. | Land | Improvement |
|---|---|---|---|---|
| 2025 | $3,182 | $24,110 | $3,060 | $21,050 |
| 2024 | $3,231 | $24,110 | $3,060 | $21,050 |
| 2023 | $3,187 | $23,750 | $1,840 | $21,910 |
| 2022 | $3,187 | $22,650 | $1,840 | $20,810 |
| 2021 | $3,419 | $23,750 | $1,840 | $21,910 |
| 2020 | $268 | $1,840 | $1,840 | $0 |
| 2019 | $208 | $1,380 | $1,380 | $0 |
| 2018 | $213 | $1,380 | $1,380 | $0 |
| 2017 | $203 | $1,380 | $1,380 | $0 |
| 2016 | $209 | $1,380 | $1,380 | $0 |
| 2015 | $205 | $1,380 | $1,380 | $0 |
| 2014 | -- | $1,380 | $1,380 | $0 |
| 2013 | -- | $1,380 | $1,380 | $0 |
Source: Public Records
Map
Nearby Homes