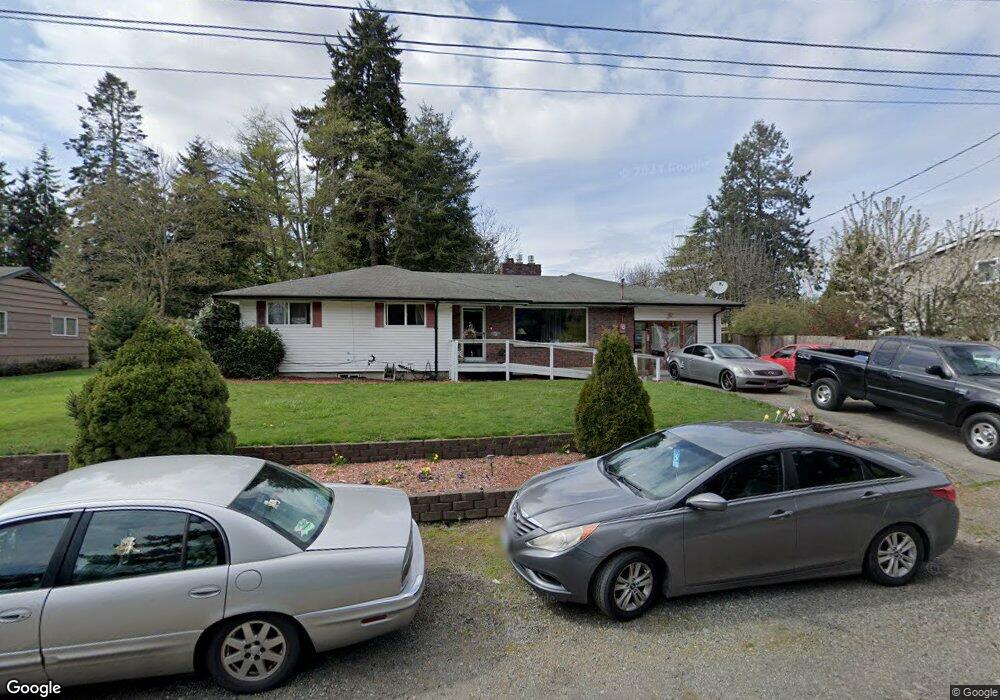
5012 E D St Tacoma, WA 98404
Eastside NeighborhoodEstimated Value: $488,000 - $550,000
3
Beds
2
Baths
2,672
Sq Ft
$191/Sq Ft
Est. Value
About This Home
This home is located at 5012 E D St, Tacoma, WA 98404 and is currently estimated at $510,641, approximately $191 per square foot. 5012 E D St is a home located in Pierce County with nearby schools including Lyon, Hunt Middle School, and Lincoln High School.
Ownership History
Date
Name
Owned For
Owner Type
Purchase Details
Closed on
Jul 30, 2002
Sold by
Va
Bought by
Clark Michael L
Current Estimated Value
Home Financials for this Owner
Home Financials are based on the most recent Mortgage that was taken out on this home.
Original Mortgage
$130,000
Outstanding Balance
$55,206
Interest Rate
6.6%
Estimated Equity
$455,435
Purchase Details
Closed on
Jan 29, 2002
Sold by
Citimortgage Inc
Bought by
Va
Purchase Details
Closed on
Feb 14, 2001
Sold by
Gregory Elva J
Bought by
Gregory James M
Create a Home Valuation Report for This Property
The Home Valuation Report is an in-depth analysis detailing your home's value as well as a comparison with similar homes in the area
Home Values in the Area
Average Home Value in this Area
Purchase History
| Date | Buyer | Sale Price | Title Company |
|---|---|---|---|
| Clark Michael L | -- | Fidelity National Title Co | |
| Va | -- | -- | |
| Gregory James M | -- | Chicago Title Insurance Co |
Source: Public Records
Mortgage History
| Date | Status | Borrower | Loan Amount |
|---|---|---|---|
| Open | Clark Michael L | $130,000 |
Source: Public Records
Tax History
| Year | Tax Paid | Tax Assessment Tax Assessment Total Assessment is a certain percentage of the fair market value that is determined by local assessors to be the total taxable value of land and additions on the property. | Land | Improvement |
|---|---|---|---|---|
| 2025 | $5,530 | $543,100 | $214,800 | $328,300 |
| 2024 | $5,530 | $526,900 | $202,900 | $324,000 |
| 2023 | $5,530 | $496,800 | $192,900 | $303,900 |
| 2022 | $5,299 | $540,200 | $206,100 | $334,100 |
| 2021 | $4,782 | $380,500 | $122,600 | $257,900 |
| 2019 | $4,096 | $346,800 | $102,500 | $244,300 |
| 2018 | $4,312 | $315,200 | $82,400 | $232,800 |
| 2017 | $3,810 | $273,000 | $70,600 | $202,400 |
| 2016 | $3,249 | $203,000 | $52,200 | $150,800 |
| 2014 | $2,866 | $186,900 | $51,500 | $135,400 |
| 2013 | $2,866 | $170,500 | $45,200 | $125,300 |
Source: Public Records
Map
Nearby Homes
Your Personal Tour Guide
Ask me questions while you tour the home.