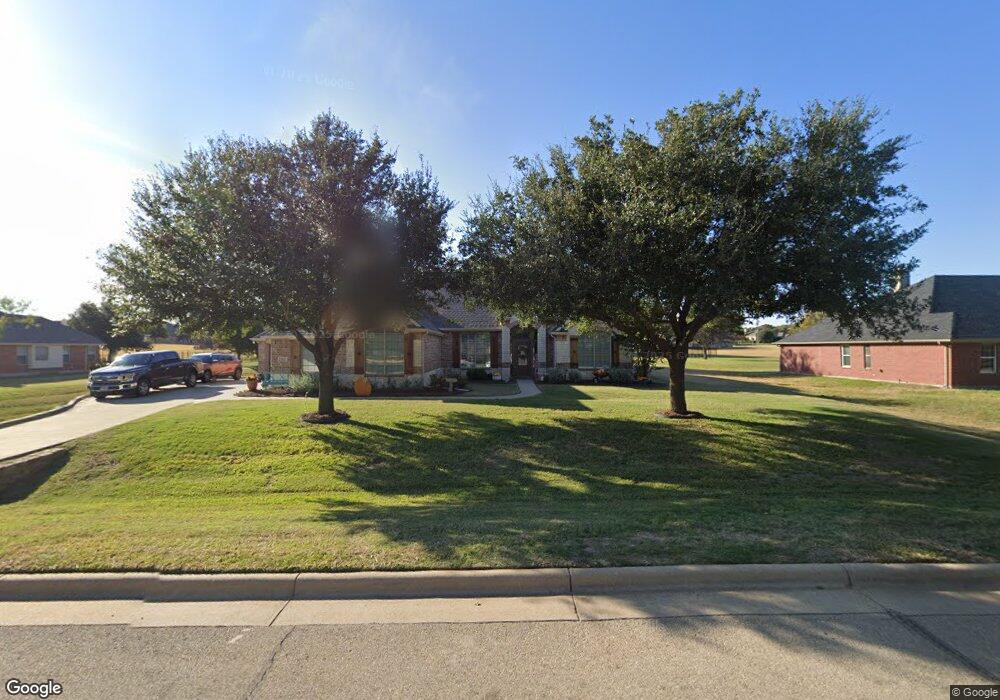
5012 Running Brook Dr Joshua, TX 76058
Estimated Value: $489,000 - $565,000
4
Beds
3
Baths
2,487
Sq Ft
$208/Sq Ft
Est. Value
About This Home
This home is located at 5012 Running Brook Dr, Joshua, TX 76058 and is currently estimated at $517,089, approximately $207 per square foot. 5012 Running Brook Dr is a home located in Johnson County with nearby schools including Plum Creek Elementary School, Joshua High School, and Joshua High School - 9th Grade Campus.
Ownership History
Date
Name
Owned For
Owner Type
Purchase Details
Closed on
Dec 2, 2020
Sold by
Sloan Mclane Llc
Bought by
Vre Joshua Llc
Current Estimated Value
Home Financials for this Owner
Home Financials are based on the most recent Mortgage that was taken out on this home.
Original Mortgage
$257,700
Outstanding Balance
$229,839
Interest Rate
2.8%
Mortgage Type
VA
Estimated Equity
$287,250
Purchase Details
Closed on
Sep 25, 2015
Sold by
Wright James Bruce and Wright Rosalie Ann
Bought by
Walker Larry L and Walker Janice A
Home Financials for this Owner
Home Financials are based on the most recent Mortgage that was taken out on this home.
Original Mortgage
$265,450
Interest Rate
5%
Mortgage Type
Adjustable Rate Mortgage/ARM
Purchase Details
Closed on
Feb 6, 2009
Sold by
Tls Homes Inc
Bought by
Wright James Bruce and Wright Rosalie Ann
Home Financials for this Owner
Home Financials are based on the most recent Mortgage that was taken out on this home.
Original Mortgage
$256,500
Interest Rate
4.91%
Mortgage Type
Purchase Money Mortgage
Create a Home Valuation Report for This Property
The Home Valuation Report is an in-depth analysis detailing your home's value as well as a comparison with similar homes in the area
Home Values in the Area
Average Home Value in this Area
Purchase History
| Date | Buyer | Sale Price | Title Company |
|---|---|---|---|
| Vre Joshua Llc | -- | None Available | |
| Walker Larry L | -- | Providence Title Co | |
| Wright James Bruce | -- | Stnt |
Source: Public Records
Mortgage History
| Date | Status | Borrower | Loan Amount |
|---|---|---|---|
| Open | Vre Joshua Llc | $257,700 | |
| Previous Owner | Walker Larry L | $265,450 | |
| Previous Owner | Wright James Bruce | $256,500 |
Source: Public Records
Tax History Compared to Growth
Tax History
| Year | Tax Paid | Tax Assessment Tax Assessment Total Assessment is a certain percentage of the fair market value that is determined by local assessors to be the total taxable value of land and additions on the property. | Land | Improvement |
|---|---|---|---|---|
| 2025 | $5,039 | $452,236 | $36,000 | $416,236 |
| 2024 | $9,906 | $407,018 | $0 | $0 |
| 2023 | $5,006 | $413,517 | $36,000 | $377,517 |
| 2022 | $8,440 | $374,797 | $36,000 | $338,797 |
| 2021 | $7,741 | $326,398 | $36,000 | $290,398 |
| 2020 | $7,611 | $277,998 | $36,000 | $241,998 |
| 2019 | $7,998 | $277,998 | $36,000 | $241,998 |
| 2018 | $8,220 | $277,998 | $36,000 | $241,998 |
| 2017 | $7,929 | $268,317 | $36,000 | $232,317 |
| 2016 | $8,145 | $275,629 | $36,000 | $239,629 |
| 2015 | $6,662 | $255,660 | $36,000 | $219,660 |
| 2014 | $6,662 | $255,660 | $36,000 | $219,660 |
Source: Public Records
Map
Nearby Homes
- 5012 Pheasant Run Dr
- 5032 Running Brook Dr
- 1000 Blue Bird Ct
- 6013 Valley View Dr
- 6020 Glenwood Dr
- 4025 Running Brook Dr
- 4012 Twin Hills Ct
- 7016 Valley View Dr
- 7008 Valley View Dr
- 2021 Running Brook Dr
- 7004 Valley View Dr
- 3012 Valley View Dr
- 2009 Running Brook Dr
- 3004 Valley View Dr
- Scottsdale II Plan at Joshua Meadows
- Lexington SE Plan at Joshua Meadows
- Nottingham I Plan at Joshua Meadows
- Fairview SE Plan at Joshua Meadows
- Wildwood SE Plan at Joshua Meadows
- Henderson Plan at Joshua Meadows
- 5008 Running Brook Dr
- 5016 Running Brook Dr
- 4009 Big Springs Dr
- 5009 Running Brook Dr
- 5000 Running Brook Dr
- 5013 Running Brook Dr
- 4005 Big Springs Dr
- 5020 Running Brook Dr
- 4013 Big Springs Dr
- 5005 Running Brook Dr
- 4001 Big Springs Dr
- 5021 Running Brook Dr
- 5001 Big Springs Dr
- 4060 Running Brook Dr
- 5001 Running Brook Dr
- 3069 Big Springs Dr
- 5028 Running Brook Dr
- 5005 Big Springs Dr
- 7025 Twin Hill
- 7025 Twin Hills Ct