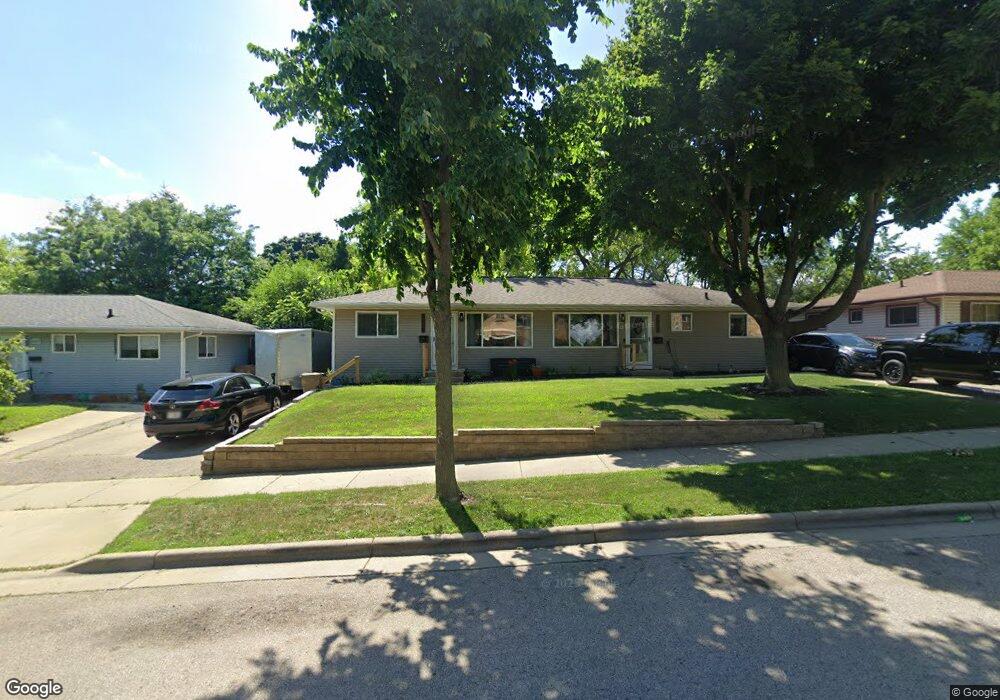
5013 - 5015 Camden Rd Madison, WI 53716
Glendale NeighborhoodEstimated Value: $337,000 - $407,000
4
Beds
2
Baths
1,800
Sq Ft
$201/Sq Ft
Est. Value
About This Home
This home is located at 5013 - 5015 Camden Rd, Madison, WI 53716 and is currently estimated at $362,667, approximately $201 per square foot. 5013 - 5015 Camden Rd is a home located in Dane County with nearby schools including Henderson Elementary School, Sennett Middle School, and La Follette High School.
Ownership History
Date
Name
Owned For
Owner Type
Purchase Details
Closed on
Apr 28, 2023
Sold by
Haak Janice M
Bought by
Haak Erich
Current Estimated Value
Home Financials for this Owner
Home Financials are based on the most recent Mortgage that was taken out on this home.
Original Mortgage
$266,130
Outstanding Balance
$258,580
Interest Rate
6.28%
Mortgage Type
New Conventional
Estimated Equity
$104,087
Purchase Details
Closed on
Jul 28, 2010
Sold by
Haines Nathan S and Deutsche Bank National Trust C
Bought by
Haak Janice M
Purchase Details
Closed on
Jul 31, 2006
Sold by
Patterson Chlaude J and Patterson Susan J
Bought by
Haines Nathan S
Home Financials for this Owner
Home Financials are based on the most recent Mortgage that was taken out on this home.
Original Mortgage
$154,260
Interest Rate
10.55%
Mortgage Type
New Conventional
Create a Home Valuation Report for This Property
The Home Valuation Report is an in-depth analysis detailing your home's value as well as a comparison with similar homes in the area
Home Values in the Area
Average Home Value in this Area
Purchase History
| Date | Buyer | Sale Price | Title Company |
|---|---|---|---|
| Haak Erich | $295,700 | None Listed On Document | |
| Haak Janice M | $85,000 | None Available | |
| Haines Nathan S | $192,000 | -- |
Source: Public Records
Mortgage History
| Date | Status | Borrower | Loan Amount |
|---|---|---|---|
| Open | Haak Erich | $266,130 | |
| Previous Owner | Haines Nathan S | $154,260 |
Source: Public Records
Tax History Compared to Growth
Tax History
| Year | Tax Paid | Tax Assessment Tax Assessment Total Assessment is a certain percentage of the fair market value that is determined by local assessors to be the total taxable value of land and additions on the property. | Land | Improvement |
|---|---|---|---|---|
| 2024 | $10,302 | $295,700 | $86,900 | $208,800 |
| 2023 | $6,766 | $375,000 | $78,900 | $296,100 |
| 2021 | $10,902 | $283,800 | $69,600 | $214,200 |
| 2020 | $7,906 | $246,800 | $65,000 | $181,800 |
| 2019 | $7,523 | $235,000 | $61,900 | $173,100 |
| 2018 | $6,869 | $226,000 | $57,800 | $168,200 |
| 2017 | $5,753 | $200,000 | $57,800 | $142,200 |
| 2016 | $4,857 | $172,600 | $53,000 | $119,600 |
| 2015 | $3,941 | $166,000 | $53,000 | $113,000 |
| 2014 | $3,944 | $166,000 | $53,000 | $113,000 |
| 2013 | $4,072 | $166,000 | $53,000 | $113,000 |
Source: Public Records
Map
Nearby Homes
- 402 W Lakeview Ave
- 1000 Tompkins Dr
- 1907-1909 Dondee Rd
- 239 Tyler Cir
- 1802 Tarragon Dr
- 4310 Hegg Ave
- 4603 Gordon Ave
- 506 Bowman Ave
- 1618 Angel Crest Way
- 5421 Admiral Dr
- 4302 Drexel Ave
- 4302 Maher Ave
- 5713 Indian Trace
- 4210 Dempsey Rd
- 4410 Winnequah Rd
- 413 Nichols Rd
- 5301 Pheasant Hill Rd
- 1910 Vondron Rd
- 127 Shato Ln Unit 127
- 5212 Midmoor Rd
- 5013 - 5015 Camden Rd
- 5015 Camden Rd
- 5013 Camden Rd
- 5011 Camden Rd
- 5009 Camden Rd
- 5017 Camden Rd
- 5019 Camden Rd
- 5007 Camden Rd
- 5012 Maher Ave
- 5021 Camden Rd
- 5008 Maher Ave
- 5016 Maher Ave
- 5012 Camden Rd Unit 1
- 5012 Camden Rd
- 5016 Camden Rd
- 5008 Camden Rd
- 5018 Maher Ave
- 5003 Camden Rd
- 5004 Maher Ave
- 5004 Camden Rd