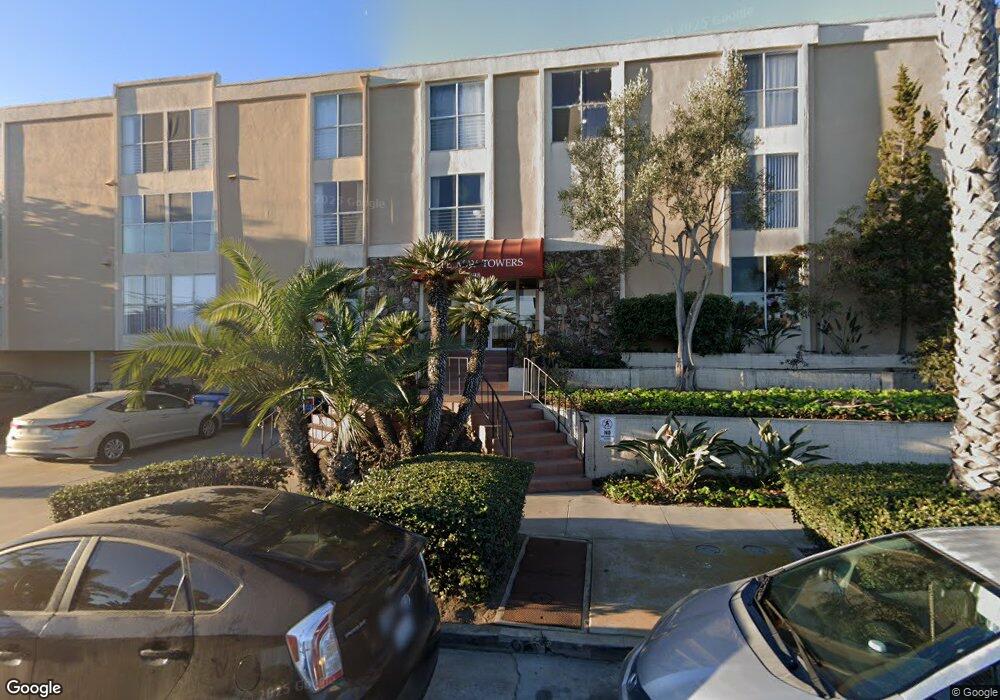
5015 Cape May Ave Unit 206 San Diego, CA 92107
Ocean Beach NeighborhoodEstimated Value: $762,000 - $927,000
2
Beds
2
Baths
962
Sq Ft
$840/Sq Ft
Est. Value
About This Home
This home is located at 5015 Cape May Ave Unit 206, San Diego, CA 92107 and is currently estimated at $808,290, approximately $840 per square foot. 5015 Cape May Ave Unit 206 is a home located in San Diego County with nearby schools including Ocean Beach Elementary School, Richard Henry Dana Middle School, and Correia Middle School.
Ownership History
Date
Name
Owned For
Owner Type
Purchase Details
Closed on
Dec 30, 2021
Sold by
Foat Jason
Bought by
Foat Jason and Foat Francisco Theresa
Current Estimated Value
Purchase Details
Closed on
Feb 24, 2015
Sold by
Springer Daniel Mark and Springer Helen M
Bought by
Foat Jason Edward
Home Financials for this Owner
Home Financials are based on the most recent Mortgage that was taken out on this home.
Original Mortgage
$304,000
Interest Rate
3.71%
Mortgage Type
New Conventional
Purchase Details
Closed on
Aug 3, 1999
Sold by
Reed Family Trust 05-25-88
Bought by
Springer Daniel Mark and Springer Helen M
Home Financials for this Owner
Home Financials are based on the most recent Mortgage that was taken out on this home.
Original Mortgage
$104,500
Interest Rate
7.83%
Create a Home Valuation Report for This Property
The Home Valuation Report is an in-depth analysis detailing your home's value as well as a comparison with similar homes in the area
Home Values in the Area
Average Home Value in this Area
Purchase History
| Date | Buyer | Sale Price | Title Company |
|---|---|---|---|
| Foat Jason | -- | None Listed On Document | |
| Foat Jason Edward | $380,000 | Title365 | |
| Springer Daniel Mark | $110,000 | Chicago Title Co |
Source: Public Records
Mortgage History
| Date | Status | Borrower | Loan Amount |
|---|---|---|---|
| Previous Owner | Foat Jason Edward | $304,000 | |
| Previous Owner | Springer Daniel Mark | $104,500 |
Source: Public Records
Tax History Compared to Growth
Tax History
| Year | Tax Paid | Tax Assessment Tax Assessment Total Assessment is a certain percentage of the fair market value that is determined by local assessors to be the total taxable value of land and additions on the property. | Land | Improvement |
|---|---|---|---|---|
| 2025 | $5,579 | $467,848 | $218,358 | $249,490 |
| 2024 | $5,579 | $458,676 | $214,077 | $244,599 |
| 2023 | $5,454 | $449,683 | $209,880 | $239,803 |
| 2022 | $5,308 | $440,866 | $205,765 | $235,101 |
| 2021 | $5,270 | $432,223 | $201,731 | $230,492 |
| 2020 | $5,205 | $427,792 | $199,663 | $228,129 |
| 2019 | $5,111 | $419,405 | $195,749 | $223,656 |
| 2018 | $4,745 | $401,378 | $191,911 | $209,467 |
| 2017 | $4,632 | $393,509 | $188,149 | $205,360 |
| 2016 | $4,558 | $385,794 | $184,460 | $201,334 |
| 2015 | $1,598 | $140,660 | $67,254 | $73,406 |
| 2014 | $1,572 | $137,906 | $65,937 | $71,969 |
Source: Public Records
Map
Nearby Homes
- 5035 Saratoga Ave
- 1975 Bacon St
- 4922 Muir Ave
- 4985 Narragansett Ave Unit 87
- 5036 W Point Loma Blvd
- 5038-40 W Point Loma Blvd
- 1817-19 Sunset Cliffs Blvd
- 4985 Coronado Ave Unit 2
- 4961-67 Coronado Ave
- 4620 Narragansett Ave
- 4768 72 Coronado Ave Ave
- 4545 Newport Ave
- 2068 Guizot St
- 4614 Larkspur St
- 2226 Etiwanda St
- 4484 Long Branch Ave
- 4434 Santa Monica Ave
- 0 Voltaire St
- 0 Voltaire St Unit 1
- 2617 Ocean Front Walk
- 5015 Cape May Ave
- 5015 Cape May Ave Unit 5015 Cape May Avenue #107
- 5015 Cape May Ave Unit 207
- 5015 Cape May Ave Unit 205
- 5015 Cape May Ave Unit 204
- 5015 Cape May Ave Unit 203
- 5015 Cape May Ave Unit 202
- 5015 Cape May Ave Unit 201
- 5015 Cape May Ave Unit 110
- 5015 Cape May Ave Unit 109
- 5015 Cape May Ave Unit 108
- 5015 Cape May Ave Unit 107
- 5015 Cape May Ave Unit 106
- 5015 Cape May Ave Unit 105
- 5015 Cape May Ave Unit 104
- 5015 Cape May Ave Unit 103
- 5015 Cape May Ave Unit 102
- 5015 Cape May Ave Unit 101
- 5015 Cape May Ave Unit 309
- 5015 Cape May Ave Unit 308