5015 Foothill Blvd Oakland, CA 94601
Fremont NeighborhoodEstimated Value: $635,000 - $748,000
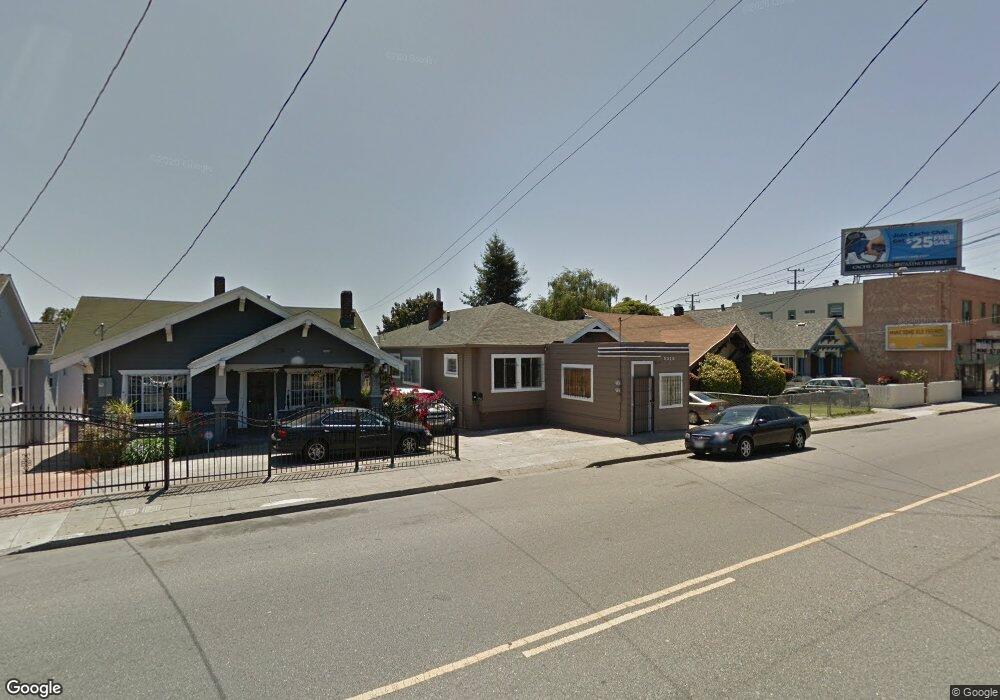
About This Home
This home is located at 5015 Foothill Blvd, Oakland, CA 94601 and is currently estimated at $708,144, approximately $367 per square foot. 5015 Foothill Blvd is a home located in Alameda County with nearby schools including Horace Mann Elementary School, Frick United Academy of Language, and Fremont High School.
Ownership History
We collect this data history from publicly available records. To have your information removed, we recommend requesting removal directly through your county’s website.
Purchase Details
Home Financials for this Owner
Home Financials are based on the most recent Mortgage that was taken out on this home.Purchase Details
Home Financials for this Owner
Home Financials are based on the most recent Mortgage that was taken out on this home.Purchase Details
Home Financials for this Owner
Home Financials are based on the most recent Mortgage that was taken out on this home.Purchase Details
Home Financials for this Owner
Home Financials are based on the most recent Mortgage that was taken out on this home.Purchase Details
Home Financials for this Owner
Home Financials are based on the most recent Mortgage that was taken out on this home.Purchase Details
Purchase Details
Home Financials for this Owner
Home Financials are based on the most recent Mortgage that was taken out on this home.Purchase Details
Home Financials for this Owner
Home Financials are based on the most recent Mortgage that was taken out on this home.Purchase Details
Home Financials for this Owner
Home Financials are based on the most recent Mortgage that was taken out on this home.Purchase Details
Home Financials for this Owner
Home Financials are based on the most recent Mortgage that was taken out on this home.Purchase Details
Home Financials for this Owner
Home Financials are based on the most recent Mortgage that was taken out on this home.Home Values in the Area
Average Home Value in this Area
Purchase History
We collect this data history from publicly available records. To have your information removed, we recommend requesting removal directly through your county’s website.
| Date | Buyer | Sale Price | Title Company |
|---|---|---|---|
| $610,000 | Chicago Title Company | ||
| $172,500 | Chicago Title Company | ||
| $171,500 | First American Title Company | ||
| $224,000 | Chicago Title Company | ||
| $135,000 | Lsi Title Company | ||
| $465,496 | Accommodation | ||
| -- | Old Republic Title Company | ||
| -- | Old Republic Title Company | ||
| $400,000 | -- | ||
| -- | -- | ||
| $215,000 | New Century Title Company | ||
| -- | New Century Title Company |
Mortgage History
We collect this data history from publicly available records. To have your information removed, we recommend requesting removal directly through your county’s website.
| Date | Status | Borrower | Loan Amount |
|---|---|---|---|
| Open | $398,000 | ||
| Previous Owner | $344,500 | ||
| Previous Owner | $343,000 | ||
| Previous Owner | $216,160 | ||
| Previous Owner | $101,250 | ||
| Previous Owner | $495,000 | ||
| Previous Owner | $495,000 | ||
| Previous Owner | $400,000 | ||
| Previous Owner | $172,000 |
Tax History
We collect this data history from publicly available records. To have your information removed, we recommend requesting removal directly through your county’s website.
| Year | Tax Paid | Tax Assessment Tax Assessment Total Assessment is a certain percentage of the fair market value that is determined by local assessors to be the total taxable value of land and additions on the property. | Land | Improvement |
|---|---|---|---|---|
| 2025 | $12,486 | $660,275 | $198,082 | $462,193 |
| 2024 | $12,486 | $647,331 | $194,199 | $453,132 |
| 2023 | $12,967 | $634,643 | $190,393 | $444,250 |
| 2022 | $10,635 | $622,200 | $186,660 | $435,540 |
| 2021 | $10,106 | $610,000 | $183,000 | $427,000 |
| 2020 | $11,725 | $702,270 | $210,681 | $491,589 |
| 2019 | $10,908 | $688,500 | $206,550 | $481,950 |
| 2018 | $10,680 | $675,000 | $202,500 | $472,500 |
| 2017 | $6,066 | $350,648 | $105,194 | $245,454 |
| 2016 | $6,162 | $343,773 | $103,132 | $240,641 |
| 2015 | $6,133 | $338,611 | $101,583 | $237,028 |
| 2014 | $6,001 | $331,980 | $99,594 | $232,386 |
Map
- 5116 Bancroft Ave
- 1618 51st Ave
- 1610 52nd Ave
- 1954 48th Ave
- 1919 48th Ave
- 4709 Foothill Blvd
- 1517 51st Ave
- 1519 48th Ave
- 2105 48th Ave
- 1436 52nd Ave
- 1345 53rd Ave
- 5465 Holland St
- 5081 Congress Ave
- 4422 Ygnacio Ave
- 5137 Fairfax Ave
- 1432 45th Ave
- 1718 High St
- 5432 Bancroft Ave
- 2261 48th Ave
- 1437 56th Ave
- 5030 Bancroft Ave
- 5036 Bancroft Ave
- 5024 Bancroft Ave
- 5042 Bancroft Ave
- 5012 Bancroft Ave
- 5046 Bancroft Ave
- 5011 Foothill Blvd
- 5054 Bancroft Ave
- 5019 Foothill Blvd
- 1673 51st Ave
- 5027 Foothill Blvd
- 5060 Bancroft Ave
- 5101 Bancroft Ave
- 5027 Bancroft Ave
- 5107 Bancroft Ave
- 1665 51st Ave
- 5033 Foothill Blvd
- 5066 Bancroft Ave
- 5021 Bancroft Ave
- 5115 Bancroft Ave
Ask me questions while you tour the home.