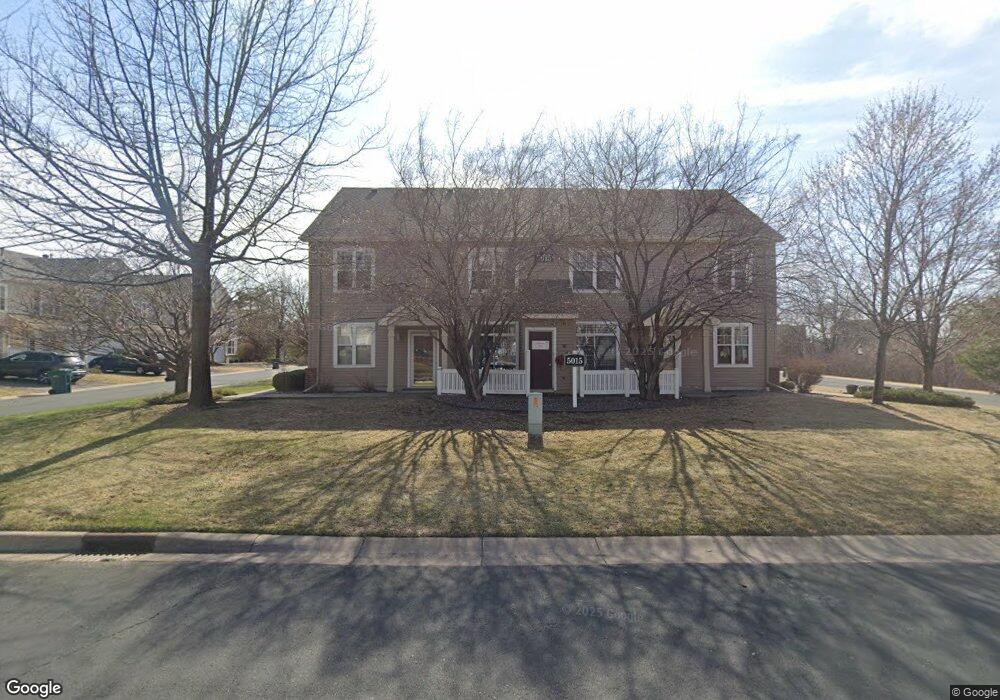
5015 Holly Ln N Unit 4 Plymouth, MN 55446
Estimated Value: $350,000 - $362,000
3
Beds
3
Baths
1,733
Sq Ft
$205/Sq Ft
Est. Value
About This Home
This home is located at 5015 Holly Ln N Unit 4, Plymouth, MN 55446 and is currently estimated at $355,302, approximately $205 per square foot. 5015 Holly Ln N Unit 4 is a home located in Hennepin County with nearby schools including Kimberly Lane Elementary School, Wayzata Central Middle School, and Wayzata High School.
Ownership History
Date
Name
Owned For
Owner Type
Purchase Details
Closed on
May 22, 2025
Sold by
Ilangovan Senthil and Ilangovan Senthil Priyadharshini
Bought by
Poopathy Perumal
Current Estimated Value
Home Financials for this Owner
Home Financials are based on the most recent Mortgage that was taken out on this home.
Original Mortgage
$270,000
Outstanding Balance
$269,073
Interest Rate
6.81%
Mortgage Type
New Conventional
Estimated Equity
$86,229
Purchase Details
Closed on
Aug 12, 2016
Sold by
Thomas Andrew
Bought by
Ilangovan Senthil and Senthil Priyadharshini
Home Financials for this Owner
Home Financials are based on the most recent Mortgage that was taken out on this home.
Original Mortgage
$216,000
Interest Rate
3.42%
Mortgage Type
New Conventional
Purchase Details
Closed on
Sep 30, 2010
Sold by
Svor Brent
Bought by
Gregg Katherine
Purchase Details
Closed on
Jul 24, 2002
Sold by
Town & Country Homes
Bought by
Suor Brent Allyn
Create a Home Valuation Report for This Property
The Home Valuation Report is an in-depth analysis detailing your home's value as well as a comparison with similar homes in the area
Home Values in the Area
Average Home Value in this Area
Purchase History
| Date | Buyer | Sale Price | Title Company |
|---|---|---|---|
| Poopathy Perumal | $360,000 | Lake Title | |
| Ilangovan Senthil | $240,000 | Home Title Inc | |
| Gregg Katherine | $185,000 | -- | |
| Suor Brent Allyn | $199,520 | -- |
Source: Public Records
Mortgage History
| Date | Status | Borrower | Loan Amount |
|---|---|---|---|
| Open | Poopathy Perumal | $270,000 | |
| Previous Owner | Ilangovan Senthil | $216,000 |
Source: Public Records
Tax History Compared to Growth
Tax History
| Year | Tax Paid | Tax Assessment Tax Assessment Total Assessment is a certain percentage of the fair market value that is determined by local assessors to be the total taxable value of land and additions on the property. | Land | Improvement |
|---|---|---|---|---|
| 2024 | $3,471 | $323,000 | $46,000 | $277,000 |
| 2023 | $3,453 | $327,500 | $46,000 | $281,500 |
| 2022 | $3,106 | $301,000 | $32,000 | $269,000 |
| 2021 | $2,875 | $265,000 | $45,000 | $220,000 |
| 2020 | $3,112 | $248,000 | $36,000 | $212,000 |
| 2019 | $2,737 | $259,000 | $53,000 | $206,000 |
| 2018 | $2,529 | $231,000 | $47,000 | $184,000 |
| 2017 | $2,363 | $202,000 | $41,000 | $161,000 |
| 2016 | $2,349 | $196,000 | $40,000 | $156,000 |
| 2015 | $2,410 | $196,100 | $40,000 | $156,100 |
| 2014 | -- | $157,200 | $40,000 | $117,200 |
Source: Public Records
Map
Nearby Homes
- 5050 Holly Ln N Unit 803
- 5055 Holly Ln N Unit 4
- 17195 49th Ave N Unit B
- 5075 Holly Ln N Unit 8
- 17330 50th Ave N
- 4980 Garland Ct N Unit G
- 17440 49th Ave N
- St. Croix Plan at Hollydale - West Collection
- Fremont Plan at Hollydale - West Collection
- Pepin Plan at Hollydale - West Collection
- Nokomis Plan at Hollydale - West Collection
- Itasca Plan at Hollydale - West Collection
- Benton Plan at Hollydale - West Collection
- Harriet Plan at Hollydale - West Collection
- Mississippi Plan at Hollydale - West Collection
- Vermillion Plan at Hollydale - West Collection
- Sutton Sport Plan at Hollydale
- Superior Sport Plan at Hollydale
- Westley Sport Plan at Hollydale
- Hillsdale Plan at Hollydale
- 5015 Holly Ln N Unit 308
- 5015 Holly Ln N Unit 307
- 5015 Holly Ln N Unit 306
- 5015 Holly Ln N Unit 305
- 5015 Holly Ln N Unit 304
- 5015 Holly Ln N Unit 303
- 5015 Holly Ln N Unit 302
- 5015 Holly Ln N Unit 301
- 5015 Holly Ln N Unit 6
- 5015 Holly Ln N Unit 8
- 5015 Holly Ln N Unit 2
- 5015 Holly Ln N Unit 3
- 5015 5015 Holly-Lane-n
- 5015 5015 Holly Ln N
- 5005 Holly Ln N Unit 208
- 5005 Holly Ln N Unit 207
- 5005 Holly Ln N Unit 206
- 5005 Holly Ln N Unit 205
- 5005 Holly Ln N Unit 204
- 5005 Holly Ln N Unit 203