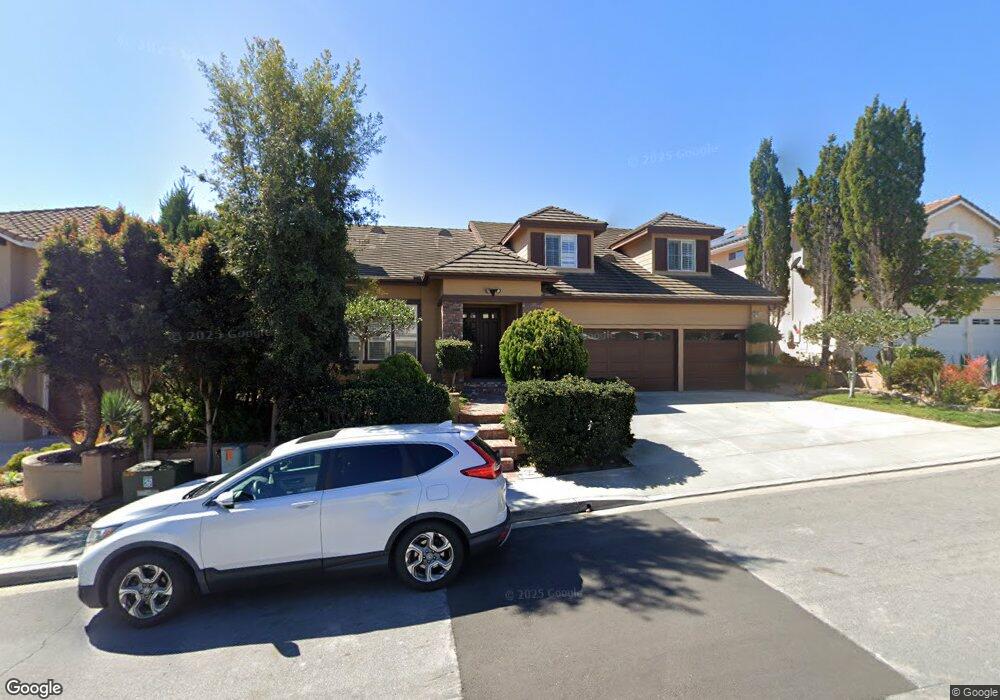
5015 Pearlman Way San Diego, CA 92130
Carmel Valley NeighborhoodEstimated Value: $2,548,668 - $2,925,000
5
Beds
3
Baths
3,297
Sq Ft
$846/Sq Ft
Est. Value
About This Home
This home is located at 5015 Pearlman Way, San Diego, CA 92130 and is currently estimated at $2,789,667, approximately $846 per square foot. 5015 Pearlman Way is a home located in San Diego County with nearby schools including Ashley Falls Elementary School, Pacific Trails Middle, and Torrey Pines High School.
Ownership History
Date
Name
Owned For
Owner Type
Purchase Details
Closed on
Dec 5, 2008
Sold by
Stark Guri Arie and Stark Leah
Bought by
Stark Guri Arie and Stark Leah
Current Estimated Value
Purchase Details
Closed on
Feb 28, 2002
Sold by
Stark Guri A and Stark Leah
Bought by
Stark Guri A and Stark Leah
Home Financials for this Owner
Home Financials are based on the most recent Mortgage that was taken out on this home.
Original Mortgage
$496,000
Outstanding Balance
$191,680
Interest Rate
6%
Estimated Equity
$2,597,987
Purchase Details
Closed on
May 4, 1999
Sold by
Blanchard Kenneth S and Blanchard Christina C
Bought by
Stark Guri A and Stark Leah
Home Financials for this Owner
Home Financials are based on the most recent Mortgage that was taken out on this home.
Original Mortgage
$512,000
Interest Rate
6.87%
Purchase Details
Closed on
Apr 28, 1998
Sold by
Standard Pacific Corp
Bought by
Blanchard Kenneth Scott and Blanchard Christina C
Create a Home Valuation Report for This Property
The Home Valuation Report is an in-depth analysis detailing your home's value as well as a comparison with similar homes in the area
Home Values in the Area
Average Home Value in this Area
Purchase History
| Date | Buyer | Sale Price | Title Company |
|---|---|---|---|
| Stark Guri Arie | -- | None Available | |
| Stark Guri A | -- | Stewart Title | |
| Stark Guri A | $640,000 | California Title Company | |
| Blanchard Kenneth Scott | $540,000 | Chicago Title Co |
Source: Public Records
Mortgage History
| Date | Status | Borrower | Loan Amount |
|---|---|---|---|
| Open | Stark Guri A | $496,000 | |
| Closed | Stark Guri A | $512,000 |
Source: Public Records
Tax History Compared to Growth
Tax History
| Year | Tax Paid | Tax Assessment Tax Assessment Total Assessment is a certain percentage of the fair market value that is determined by local assessors to be the total taxable value of land and additions on the property. | Land | Improvement |
|---|---|---|---|---|
| 2025 | $11,766 | $1,003,319 | $423,273 | $580,046 |
| 2024 | $11,766 | $983,647 | $414,974 | $568,673 |
| 2023 | $11,698 | $964,361 | $406,838 | $557,523 |
| 2022 | $11,513 | $945,453 | $398,861 | $546,592 |
| 2021 | $11,141 | $926,916 | $391,041 | $535,875 |
| 2020 | $11,226 | $917,413 | $387,032 | $530,381 |
| 2019 | $11,032 | $899,426 | $379,444 | $519,982 |
| 2018 | $10,607 | $881,791 | $372,004 | $509,787 |
| 2017 | $10,432 | $864,502 | $364,710 | $499,792 |
| 2016 | $10,135 | $847,552 | $357,559 | $489,993 |
| 2015 | $10,004 | $834,822 | $352,189 | $482,633 |
| 2014 | $9,826 | $818,470 | $345,291 | $473,179 |
Source: Public Records
Map
Nearby Homes
- 4970 Beauchamp Ct
- 4919 Concannon Ct
- 12722 Sandy Crest Ct
- 5091 Ruette de Mer
- 5480 Valerio Trail
- 13120 Chambord Way
- 13625 Winstanley Way
- 5582 Valerio Trail
- 4436 Heritage Glen Ln
- 4271 Corte Favor
- 12436 Cavallo St
- 5621 Shasta Daisy Trail
- 5171 Del Mar Mesa Rd
- 5312 Sweetwater Trail
- 5146 Rancho Verde Trail
- 4695 Rancho Verde Trail
- 12936 Carmel Creek Rd Unit 63
- 4945 Rancho Verde Trail
- 12370 Carmel Country Rd Unit 202
- 12372 Carmel Country Rd Unit 207
- 5029 Pearlman Way
- 5001 Pearlman Way
- 12987 Harwick Ln
- 12999 Harwick Ln
- 12975 Harwick Ln
- 5012 Pearlman Way
- 5002 Pearlman Way
- 5022 Pearlman Way
- 12963 Harwick Ln
- 5045 Pearlman Way
- 4991 Pearlman Way
- 5028 Pearlman Way
- 12951 Harwick Ln
- 13005 Harwick Ln
- 4988 Pearlman Way
- 5036 Pearlman Way
- 5049 Seashell Place
- 5061 Seashell Place
- 5059 Pearlman Way
- 12982 Harwick Ln